TAI BUI
Back to curriculum
LearnPython

LLM Observability Stack Selection

The 2026 observability market splits in two. Development platforms (LangSmith, Langfuse, Comet Opik) bundle monitoring with evals, prompt management, and session replay. Gateway and instrumentation tools (Helicone, SigNoz, OpenLLMetry, Phoenix) focus on telemetry. Langfuse has an MIT-licensed core and a strong OSS balance (50K events/month free on cloud). Phoenix is OpenTelemetry-native under Elastic License 2.0, excellent for drift and RAG visualization but not a persistent production backend. Arize AX uses zero-copy Iceberg/Parquet integration and claims to be 100x cheaper than monolithic observability. LangSmith leads for LangChain/LangGraph at $39/user/mo, with self-host on Enterprise only. Helicone is proxy-based with a 15-30 minute setup and 100K req/mo free, but goes less deep on agent traces. The common production pattern is a gateway (Helicone/Portkey) plus an eval platform (Phoenix/TruLens), glued together by OpenTelemetry.

TIME: ~60 minutesPREREQUISITES: Phase 17 · 08 (Inference Metrics), Phase 14 (Agent Engineering)

Learning Objectives

  • Distinguish development platforms (bundled: evals + prompts + sessions) from gateway/telemetry tools (traces + metrics only).
  • Map six major tools (Langfuse, LangSmith, Phoenix, Arize AX, Helicone, Opik) to their licensing, pricing, and sweet-spot use cases.
  • Explain the OpenTelemetry-glue pattern that lets you combine a gateway tool with a separate eval platform.
  • Name the 2026 cost differentiator (Arize AX's zero-copy approach vs monolithic ingest) and state the rough 100x multiplier.

The Problem

You shipped an LLM feature. It works. You have no visibility into prompt failures, tool loops, latency regressions, cost spikes, or prompt-cache hit rate. You Google "LLM observability" and get eight tools all claiming they solve the same problem at three different price points.

They don't solve the same problem. LangSmith answers "why did this LangGraph run fail?" Phoenix answers "is my RAG pipeline drifting?" Helicone answers "which app is burning tokens?" Langfuse answers "can I self-host the whole thing?" Different tools serve different audiences.

Picking involves four axes: stack (LangChain? raw SDK? multi-vendor?), license tolerance (MIT only? Elastic OK? commercial fine?), budget (free tier? $100/mo? $1000/mo?), and self-host (must? nice-to-have? never?).
Warm-up0/2
1. In Phase 17 · 08 you tracked per-request latency and token throughput. To attribute a dollar cost to each LLM call in a trace, which fields must the trace record?Warm-up
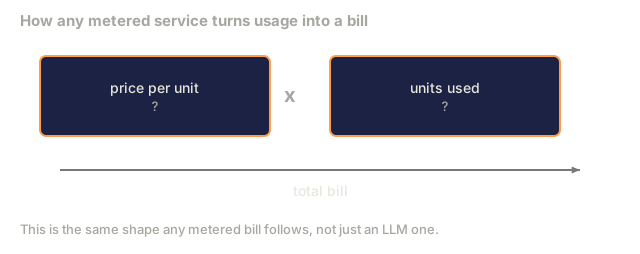
Two boxes, price per unit and units used, both marked with a question mark, joined by a multiplication sign, feeding into a total bill. No numbers are shown.
Generic usage-based billing shape. Typed, no specific service named.
2. A dashboard shows a P99 latency of 300 ms for an endpoint. What does that figure mean?Warm-up
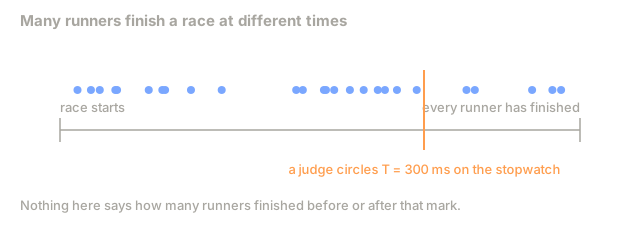
A scatter of dots representing many runners finishing a race at scattered times along a timeline, with one vertical line marking a judge circling 300 milliseconds on the stopwatch. No count of runners before or after that line is given.
Everyday race analogy, typed. No fraction of runners before or after the mark is shown.

The Concept

Two categories

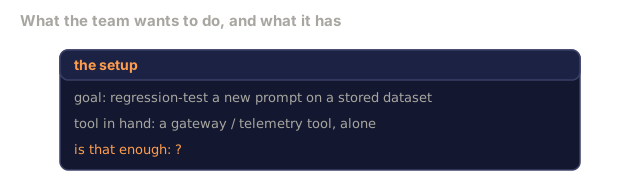
Development platforms bundle observability with evals, prompt management, dataset versioning, session replay. You run experiments, see which prompt worked, and regression-test a new prompt against old winners on a dataset. LangSmith, Langfuse, Comet Opik.

Gateway/telemetry tools instrument inference calls and record the prompt, response, tokens, latency, model, and cost. Helicone, SigNoz, OpenLLMetry, Phoenix. They are minimalist, and you can combine them with a separate eval tool through OpenTelemetry.

Langfuse: OSS balance

  • Core Apache / MIT licensed; self-host via Docker.
  • Cloud free tier: 50K events/month. Paid: $29/mo for team.
  • Evals, prompt management, traces, datasets. Reasonable coverage of all four dev-platform features.
  • Sweet spot: you want LangSmith-class features but must self-host or stay on OSS license.

Phoenix (Arize): telemetry-first, OpenTelemetry-native

  • Elastic License 2.0; self-host trivial.
  • Excellent at RAG and drift visualization. Embedding-space scatter plots shipped as first-class.
  • Not designed as persistent production backend, mostly development-time observability.
  • Sweet spot: RAG pipeline development, drift debugging, pairs with a separate gateway for production.

Arize AX: the scale play

  • Commercial. Zero-copy data lake integration via Iceberg/Parquet.
  • Claims to be ~100x cheaper than monolithic observability (Datadog-class) at scale. The idea is that you store traces as Parquet in your own S3 bucket and Arize reads them in place.
  • Sweet spot: >10M traces/day, existing data lake, want LLM-specific dashboards without Datadog pricing.

LangSmith: LangChain/LangGraph first

  • Commercial, $39/user/month. Self-host only on Enterprise.
  • Best-in-class for LangChain and LangGraph stacks. If you are not on either, it is less compelling.
  • Sweet spot: team committed to LangChain, willing to pay.

Helicone: proxy-based minimum viable

  • 15-30 minute setup by swapping your OPENAI_API_BASE to Helicone proxy.
  • MIT licensed; 100K req/mo free, paid $20/mo+.
  • Includes failover, caching, rate limits, so it acts as a gateway too.
  • Less depth on agent / multi-step traces.
  • Sweet spot: quick start, single-stack app, need gateway + observability in one.

Opik (Comet): OSS dev platform

  • Apache 2.0, fully OSS.
  • Similar feature set to Langfuse with Comet heritage.
  • Sweet spot: ML teams already on Comet, want LLM observability in the same pane.

SigNoz: OpenTelemetry-first full APM

  • Apache 2.0. Handles general APM plus LLM via OpenTelemetry.
  • Sweet spot: unified observability across services and LLM calls.

The glue: OpenTelemetry + GenAI semantic conventions

OpenTelemetry published GenAI semantic conventions in late 2025 (gen_ai.system, gen_ai.request.model, gen_ai.usage.input_tokens). Tools that consume OTel can interoperate. The production pattern emerging:

  1. Emit OTel with GenAI conventions from every LLM call.
  2. Route to gateway (Helicone / Portkey) for day-to-day.
  3. Dual-ship to eval platform (Phoenix / Langfuse) for regressions.
  4. Archive in data lake (Iceberg) for long-term analysis via Arize AX or DuckDB.

The trap: instrumenting at the wrong layer

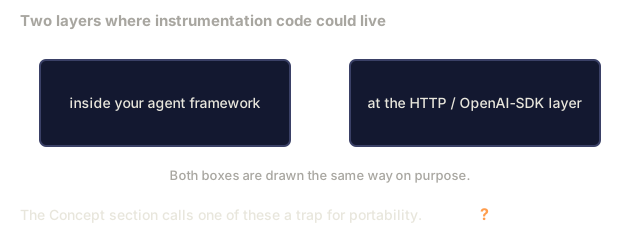
Instrumenting inside your agent framework (say, adding LangSmith traces) couples you to that framework. Instrumenting at the HTTP/OpenAI-SDK layer, via OpenLLMetry or your gateway, is portable.

Sampling: you can't keep everything

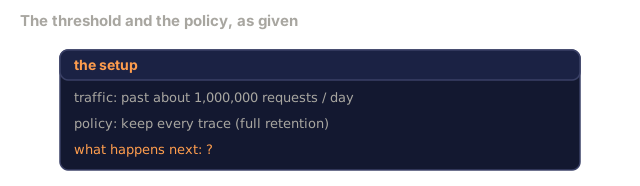
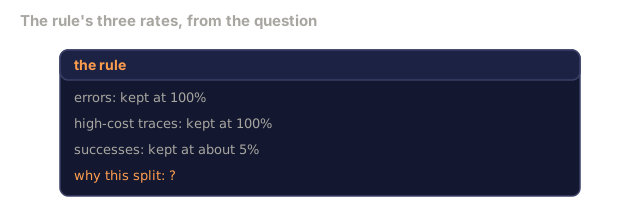
At >1M requests/day, full-trace retention costs more than the LLM calls. Sample by rules: 100% errors, 100% high-cost, 5% success. Keep aggregates always; keep raw for the long tail.

Numbers you should remember

  • Langfuse free cloud: 50K events/month.
  • LangSmith: $39/user/month.
  • Helicone free: 100K req/month.
  • Arize AX claim: ~100x cheaper than monolithic at scale.
  • OpenTelemetry GenAI conventions: 2025 shipping, 2026 widely adopted.
Check: The Concept0/27
1. What is a development platform in LLM observability?Define
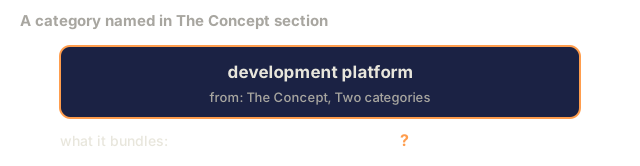
A card naming the term development platform, tagged to The Concept section's Two categories part, with what it bundles left as a question mark.
The term as the lesson names it. What it bundles is the question.
2. What is a gateway/telemetry tool in LLM observability?Define
A card naming the term gateway slash telemetry tool, tagged to The Concept section's Two categories part, with what it records left as a question mark.
The term as the lesson names it. What it records is the question.
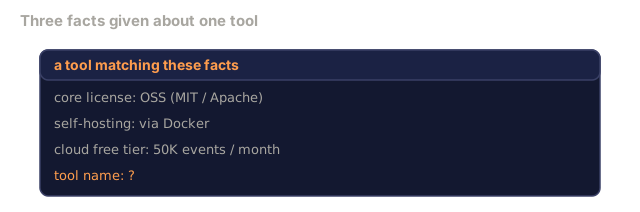
3. Which tool combines an open-source licensed core, self-hosting via Docker, and a 50K events/month free cloud tier?Define
A card listing three facts about an unnamed tool: an OSS MIT or Apache core license, self-hosting via Docker, and a cloud free tier of 50K events per month, with the tool name left as a question mark.
The three facts exactly as given in the question. The name is the question.
4. What license does Phoenix (Arize) ship under, and what production role does it fit?Define
A card naming Phoenix from Arize, tagged to The Concept section's Phoenix part, with its license and its production role both left as question marks.
The tool as named in the question. Its license and production role are the question.
5. What is Arize AX?Define
A card naming Arize AX, tagged to The Concept section's Arize AX part, with what it is left as a question mark.
The term as the lesson names it. What it is is the question.
6. What are LangSmith's pricing and self-host terms?Define
A card naming LangSmith, tagged to The Concept section's LangSmith part, with its price and its self-host tier both left as question marks.
The tool as named in the question. Its price and self-host tier are the question.
7. What setup time and free-tier limit apply to Helicone?Define
A card naming Helicone, tagged to The Concept section's Helicone part, with its setup time and its free tier limit both left as question marks.
The tool as named in the question. Its setup time and free tier limit are the question.
8. What is Opik?Define
A card naming Opik, tagged to The Concept section's Opik part, with what it is left as a question mark.
The term as the lesson names it. What it is is the question.
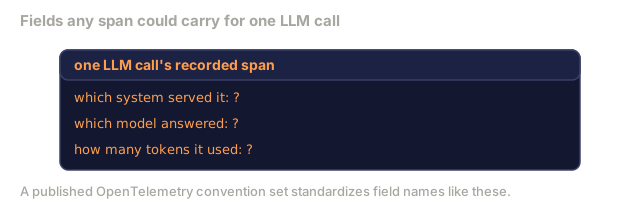
9. Which OpenTelemetry conventions act as the interop layer between observability tools?Define
A card for one generic LLM call span with three unlabeled fields: which system served it, which model answered, and how many tokens it used, each a question mark. A note says a published OpenTelemetry convention set standardizes fields like these.
Generic span fields, typed. No convention name or attribute key is shown.
10. What is OpenLLMetry?Define
A card naming OpenLLMetry, tagged to The Concept section's glue part, with what it is left as a question mark.
The term as the lesson names it. What it is is the question.
11. What is session replay?Define
A card naming session replay, tagged to the Key Terms section, with what it is left as a question mark.
The term as the lesson names it. What it is is the question.
12. What is an eval in this lesson's sense?Define
A card naming eval, tagged to the Key Terms section, with what it is left as a question mark.
The term as the lesson names it. What it is is the question.
13. What is Arize AX's main cost claim relative to monolithic observability like Datadog, and what mechanism backs it?Explain
A card naming Arize AX, tagged to The Concept section's Arize AX part, with its cost claim relative to monolithic observability and the mechanism behind that claim both left as question marks.
The tool as named in the question. Its cost claim and the mechanism behind it are the question.
14. Which instrumentation choice does The Concept section call a trap for portability?Explain
Two identically styled boxes: instrumenting inside your agent framework, and instrumenting at the HTTP or OpenAI-SDK layer, with a note that one of them is called a trap for portability, left unresolved which.
Both instrumentation layers drawn with identical, neutral styling. Typed.
15. You want to regression-test a new prompt against earlier winning prompts on a stored dataset. Why is a gateway/telemetry tool alone not enough?Explain
A card stating the goal of regression-testing a new prompt against a stored dataset, the tool in hand being a gateway or telemetry tool alone, and whether that is enough left as a question mark.
The goal and the tool, exactly as given in the question.
16. Why does full-trace retention stop scaling past about 1M requests/day?Explain
A card stating the traffic level, past about 1,000,000 requests a day, the policy of keeping every trace, and what happens next left as a question mark.
The threshold and the policy, exactly as given in the question.
17. Why does the sampling rule keep 100% of errors and high-cost traces but only about 5% of successes?Explain
A card listing the sampling rule's three rates: errors kept at 100 percent, high-cost traces kept at 100 percent, and successes kept at about 5 percent, with why this split exists left as a question mark.
The rule's rates, exactly as given in the question.
18. What trade-off does Helicone's proxy approach make?Explain
A card naming Helicone, tagged to The Concept section's Helicone part, with its trade-off left as a question mark.
The tool as named in the question. Its trade-off is the question.
19. How do Opik and SigNoz differ?Explain
Two cards on one canvas: Opik, tagged to The Concept section's Opik part, and SigNoz, tagged to The Concept section's SigNoz part, each with what it is left as a question mark.
Both terms as the lesson names them. What each one is is the question.
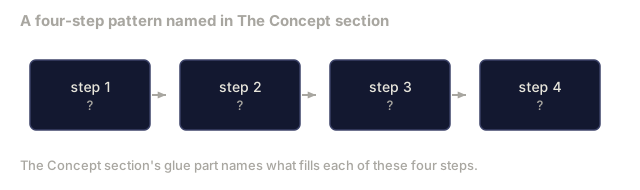
20. What is the four-step production pattern for gluing observability tools together with OpenTelemetry?Explain
A pipeline of four identical boxes, step 1 through step 4, each marked with a question mark, joined by arrows, with a note that The Concept section's glue part names what fills each step.
Pipeline shape only, typed. No step is filled in and no step order content is shown.
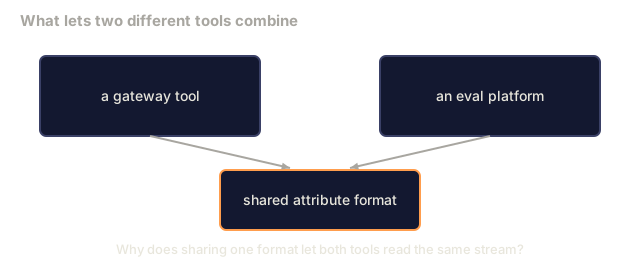
21. Why does emitting OpenTelemetry GenAI attributes from every call let you combine a gateway with a separate eval platform?Explain
Two boxes, a gateway tool and an eval platform, both with arrows pointing down into a box labelled shared attribute format, with a question about why sharing one format lets both tools read the same stream.
Generic two-tool setup, typed. No convention name is shown.
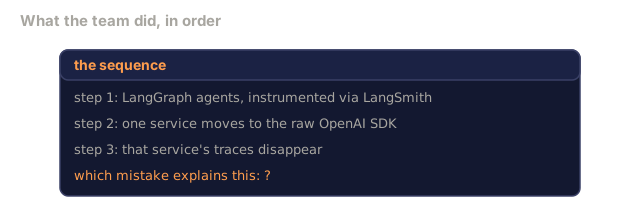
22. A team instruments its LangGraph agents with LangSmith traces, then moves one service to the raw OpenAI SDK, and its traces for that service disappear. Which mistake explains this?Analyze
A card listing three steps: instrumenting LangGraph agents via LangSmith traces, moving one service to the raw OpenAI SDK, and that service's traces disappearing, with which mistake explains this left as a question mark.
The sequence of events exactly as given in the question.
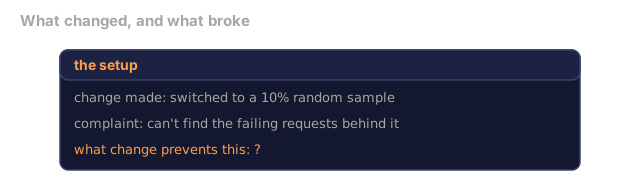
23. After switching to a 10% random sample, a team cannot find the failing requests behind a customer complaint. Which change would most directly have prevented this?Analyze
A card stating that a team switched to a 10 percent random sample and now cannot find the failing requests behind a customer complaint, with what change would prevent this left as a question mark.
The change and the complaint exactly as given in the question.
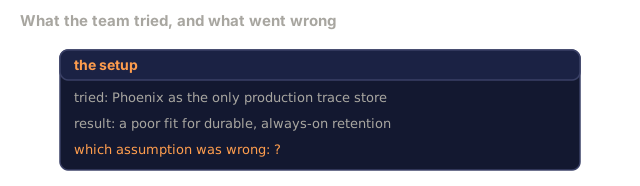
24. A team uses Phoenix as the only production trace store and finds it a poor fit for durable, always-on retention. Which assumption was wrong?Analyze
A card stating that a team used Phoenix as the only production trace store and found it a poor fit for durable, always-on retention, with which assumption was wrong left as a question mark.
The attempt and the result exactly as given in the question.
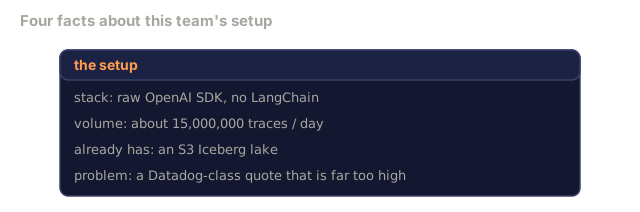
25. Your team calls the raw OpenAI SDK (no LangChain), produces about 15M traces/day, already keeps data in an S3 Iceberg lake, and got a Datadog-class quote that is far too high. Which stack fits best?Design
A card listing four facts about a team's setup: the raw OpenAI SDK with no LangChain, about 15,000,000 traces a day, an existing S3 Iceberg lake, and a Datadog-class quote that is far too high.
The team's requirements exactly as given in the question.
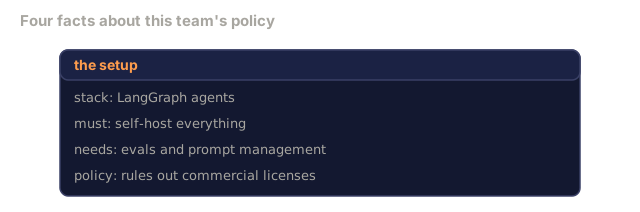
26. You run LangGraph agents, must self-host everything, need evals and prompt management, and your policy rules out commercial licenses. Which tool fits best?Design
A card listing four facts about a team's policy: LangGraph agents, a requirement to self-host everything, a need for evals and prompt management, and a policy that rules out commercial licenses.
The team's requirements exactly as given in the question.
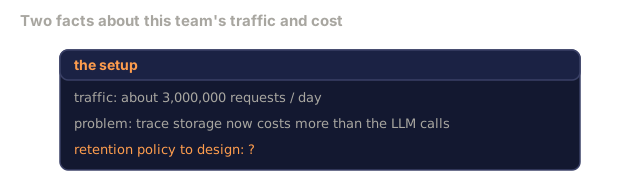
27. You expect about 3M requests a day and trace storage now costs more than the LLM calls. Which retention policy do you design?Design
A card stating that a team expects about 3,000,000 requests a day and trace storage already costs more than the LLM calls themselves, with the retention policy to design left as a question mark.
The traffic and cost facts exactly as given in the question.

Use It

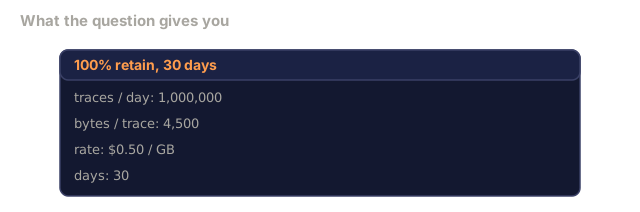
code/main.py simulates a 1M-trace day across five retention strategies (100% retain, 10% random sample, 5% success plus errors, 5% success plus errors and high-cost, 1% aggregates). It reports the daily GB retained, how many traces get dropped, and a 30-day storage cost projection under each (monolithic ingest, Arize AX, and plain S3).
Check: Use It0/8
1. What does the retention simulation actually demonstrate, independent of any price?Explain
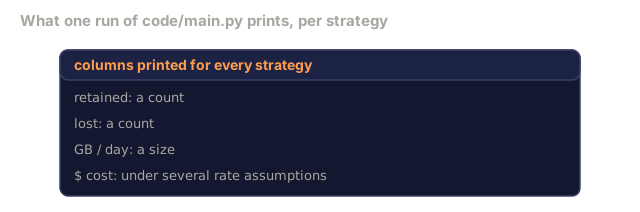
A card listing the column names code/main.py prints for every retention strategy: retained, a count; lost, a count; GB per day, a size; and dollar cost, under several rate assumptions. No strategy names or numbers are shown.
Column names from a real run of code/main.py; no row values shown.
2. In main.py, strategy '100% retain' keeps all 1,000,000 traces at 4,500 bytes each. With a $0.50 per GB monolithic rate, what is its monthly monolithic cost (30 days)?Apply
A card for the 100 percent retain strategy over 30 days, giving 1,000,000 traces a day, 4,500 bytes per trace, a rate of 0.50 dollars per GB, and 30 days.
The inputs exactly as given in the question.
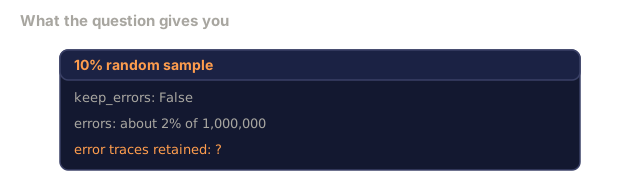
3. In main.py, the '10% random sample' strategy has keep_errors set to False, and about 2% of the 1M traces are errors. Roughly how many error traces does it retain?Apply
A card for the 10 percent random sample strategy: keep_errors is False, errors are about 2 percent of 1,000,000, and the number of error traces retained is left as a question mark.
The strategy's settings exactly as given in the question.
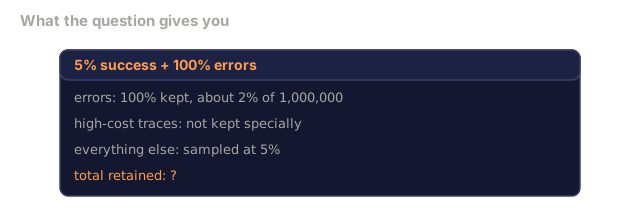
4. With 2% errors and high-cost not kept, roughly how many traces does the '5% success + 100% errors' strategy retain from 1M?Apply
A card for the 5 percent success plus 100 percent errors strategy: errors are 100 percent kept and about 2 percent of 1,000,000, high-cost traces are not kept specially, everything else is sampled at 5 percent, and total retained is left as a question mark.
The strategy's settings exactly as given in the question.
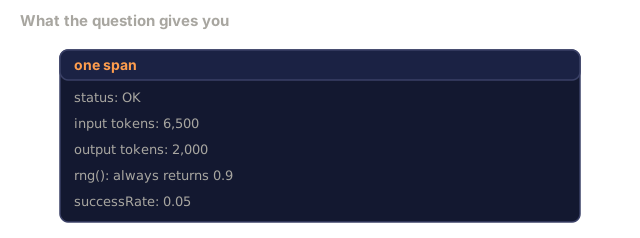
5. main.ts uses makeSamplingExporter(inner, 0.05, rng) with an rng that always returns 0.9. A span with status OK has 6,500 input tokens and 2,000 output tokens. Is it passed to the inner exporter?Apply
A card for one span: status OK, 6,500 input tokens, 2,000 output tokens, an rng function that always returns 0.9, and a success rate of 0.05.
The span's values exactly as given in the question.
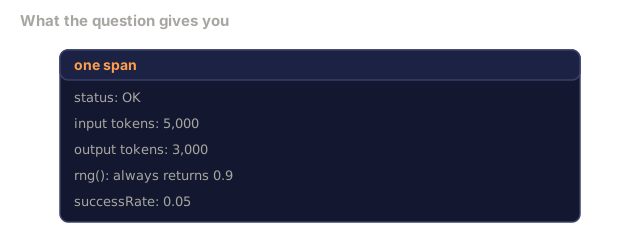
6. With the same exporter and an rng that always returns 0.9, a span with status OK has 5,000 input tokens and 3,000 output tokens. What happens to it?Apply
A card for one span: status OK, 5,000 input tokens, 3,000 output tokens, an rng function that always returns 0.9, and a success rate of 0.05.
The span's values exactly as given in the question.
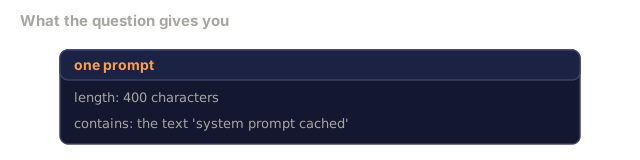
7. In main.ts, mockLLMCall receives a 400-character prompt that contains the text 'system prompt cached'. Which token counts does the traced span record?Apply
A card for one prompt: 400 characters long, containing the text system prompt cached.
The prompt's properties exactly as given in the question.
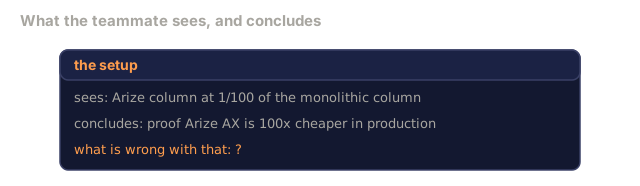
8. A teammate sees the Arize AX column at 1/100 of the monolithic column in the main.py table and cites it as proof that Arize AX is 100x cheaper in production. What is wrong with that claim?Analyze
A card stating that a teammate sees the Arize column at one one-hundredth of the monolithic column in a table and concludes that this proves Arize AX is 100 times cheaper in production, with what is wrong with that conclusion left as a question mark.
The claim exactly as given in the question.

Ship It

This lesson produces outputs/skill-observability-stack.md. Give it your stack, scale, budget, and license posture, and it picks the tool or tools.

Author's Note

I'd run main.py first and read the table before the vendor list. Every strategy sees the same simulated day: 1M traces, 2% errors, 1% high-cost, a fixed seed. So the retained and lost columns compare retention rules directly, and you can watch what "5% success + 100% errors" does to the count against "10% random sample", which keeps only 10% of errors, same as everything else.

One thing to keep straight when you read the cost columns. The 100x gap is an input, not a result. The script sets the monolithic rate at $0.50 per GB and the Arize AX rate at $0.005 per GB, so the ratio between those columns is the vendor claim restated. What the simulation does show is how much sampling shrinks the GB, and that part is independent of any price.

I'd also read main.ts for the instrumentation half, since the Python file only covers retention. It wraps a mocked LLM call in a span carrying gen_ai.system, gen_ai.request.model, and gen_ai.usage.input_tokens, then puts a sampling exporter in front of the console exporter that keeps errors and any span over 8,000 total tokens. That is the "emit OTel at the call site, decide what to keep downstream" shape from the concept section, and it is the piece I'd copy first.

Exercises

  1. Your team on LangChain wants OSS self-hosted observability. Pick Langfuse or Opik and justify.
  2. At 5M traces/day with Datadog quotes $150K/month, compute break-even for Arize AX.
  3. Design an OpenTelemetry GenAI attribute set your org's guideline should mandate on every LLM call.
  4. Argue whether Phoenix alone is sufficient for production. When does it not suffice?
  5. Helicone is 20ms proxy overhead. At P99 TTFT 300 ms, is that acceptable? What if SLA is 100 ms?

Key Terms

TermWhat people sayWhat it actually means
OpenLLMetry"OTel for LLMs"Open-source OpenTelemetry instrumentation for LLMs
GenAI conventions"OTel attributes"Standard OTel attribute names for LLM calls
LangSmith"LangChain observability"Commercial platform bundled with LangChain ecosystem
Langfuse"OSS LangSmith"MIT OSS with similar feature set
Phoenix"Arize dev tool"OpenTelemetry-native dev/eval platform
Arize AX"scale observability"Commercial zero-copy Iceberg/Parquet observability
Helicone"proxy observability"HTTP proxy collecting LLM telemetry + gateway features
Opik"Comet LLM"Apache 2.0 OSS dev platform from Comet
Session replay"trace rerun"Replay a full agent session with tool calls
Eval"offline test"Running candidate model/prompt over labeled dataset

Further Reading

Code

Ships With