TAI BUI
Back to curriculum
LearnPython

FinOps for LLMs — Unit Economics and Multi-Tenant Attribution

Traditional FinOps breaks on LLM spend. Costs are token transactions, not resource uptime, and tags don't map because an API call is a transaction, not an asset. Prompt design, context window, and output length are financial decisions. Instrument three attribution dimensions on day one: per-user (`user_id`) for seat pricing and expansion, per-task (`task_id` + `route`) for product surface cost, per-tenant (`tenant_id`) for unit economics and renewal. Split spend into four token layers (prompt, tool, memory, response), because one bucket hides where it goes. For multi-tenant products, enforce in three steps: a rate limit per tenant (2-3x expected peak, a clear 429 with retry-after), a daily spend cap (1.5-3x the contracted ceiling, which tightens the rate limit and alerts), and a kill switch on spend z-score > 4 (auto-pause and page on-call). Attribution patterns range from tag-and-aggregate to the telemetry joiner (trace ID to billing, the most accurate), sampling and extrapolation, model-based allocation, event-sourced, and real-time streaming. Measure cost per resolved query or per generated artifact, not $/M tokens. Retroactive tagging misses edge cases, so stamp the request when you create it.

TIME: ~60 minutesPREREQUISITES: Phase 17 · 13 (Observability), Phase 17 · 14 (Caching)

Learning Objectives

  • Explain why traditional FinOps (tags + tiers) breaks on LLM spend and name the three new attribution dimensions.
  • Enumerate the four token layers (prompt, tool, memory, response) and why single-bucket billing hides cost.
  • Design an enforcement ladder (rate → spend cap → kill switch) for a multi-tenant product.
  • Pick a unit metric (cost per resolved query / artifact) instead of $/M tokens.

The Problem

Your bill says $40,000. You don't know:

  • Which tenant spent it.
  • Which product feature drove it.
  • Whether any individual user was abusive.
  • Whether prompt bloat, tool calls, or memory amplification was the culprit.

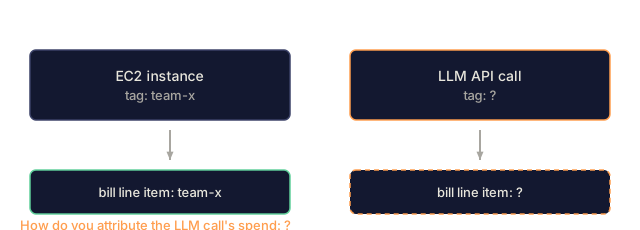
Tag-and-aggregate on the provider side works for cloud resources (EC2, S3), where tags propagate to line items. LLM API calls don't auto-tag. You have to stamp user, task, and tenant at the call site and carry them through. Attribution added after the fact always misses edge cases.
Warm-up0/3
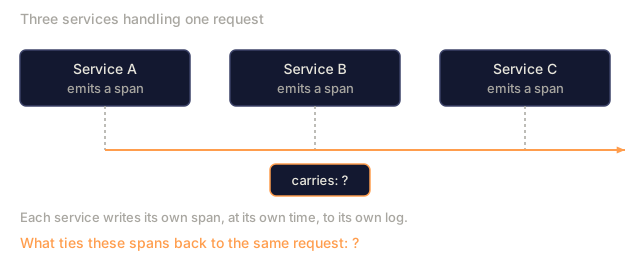
1. In a distributed tracing system, what links the spans emitted by different services to the same request?Warm-up
Three service boxes in a row, Service A, B and C, each emitting a span, each dropping a dashed line down to a single shared arrow below labelled carries, followed by a question mark. A line asks what ties these spans back to the same request.
Setup: the row of services and the fact that each writes its own span. What actually carries the link between them is left blank.
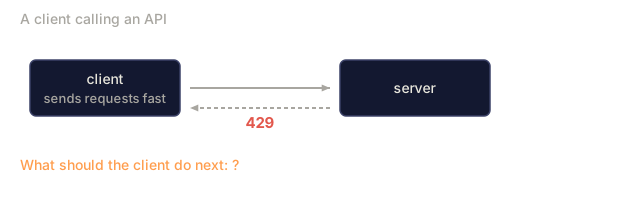
2. An API returns HTTP status 429 to your client. What does that status normally mean?Warm-up
A client sending requests quickly to a server, with a dashed response arrow labelled 429 going back to the client. A line asks what the client should do next.
Setup: the given status code only. What it means for the client's next move is left blank.
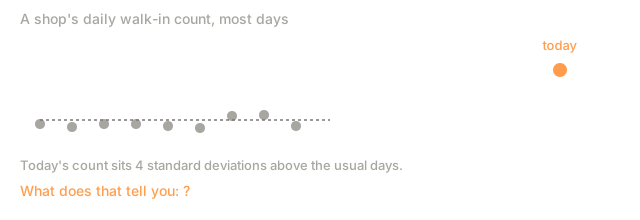
3. Today's value is 4 standard deviations above the mean of its past values. What does that tell you?Warm-up
A cluster of dots for a shop's usual daily walk-in count near a dashed reference line, with one dot for today drawn far above the cluster. A line states today sits 4 standard deviations above the usual days and asks what that tells you.
Setup: the given 4-standard-deviation fact and the shape of an ordinary spread. What it actually implies is left blank.
Check: The Problem0/2
1. Why does tag-and-aggregate on the provider side work for EC2 but not for LLM API calls?Explain
Two parallel columns, an EC2 instance tagged team-x flowing into a bill line item already itemized that way, and an LLM API call with an unknown tag flowing into a blank bill line item. A line asks how to attribute the LLM call's spend.
Setup: the EC2 case resolved as given by cloud tagging, the LLM case left blank.
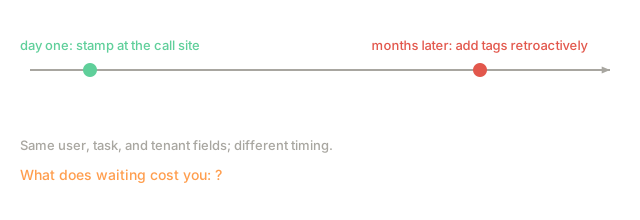
2. Why does the lesson say to stamp user, task, and tenant at the call site on day one?Explain
A timeline with two marked points, stamping user, task and tenant at the call site on day one, and adding the same tags retroactively months later. A line asks what waiting costs you.
Setup: the two timings only. The cost of waiting is left blank.

The Concept

Three attribution dimensions

Per-user (user_id): who is costing what. Drives seat pricing, expansion conversations, identifies power users.

Per-task (task_id + route): which product surface costs what. Drives feature prioritization, kill-expensive-features decisions.

Per-tenant (tenant_id): which customer is profitable. Drives unit economics, renewal pricing, tier thresholds.

Instrument all three at the call site on day one. Doing it later costs more and misses more.

Four token layers

LayerExampleTypical % of total
Promptsystem + user input40-60%
Tooltool-call results fed back20-40% (agent workloads)
Memoryprior conversation / retrieved docs10-30%
Responsemodel output10-30%

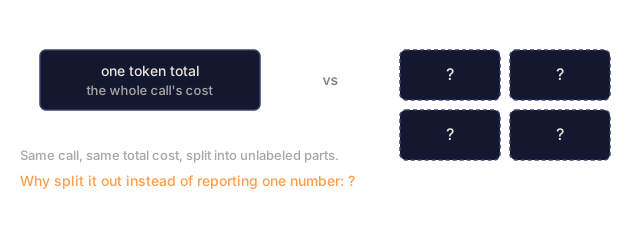
Lump all four into one number and you can't tell which one to optimize. Break them out in your attribution schema.

Enforcement ladder

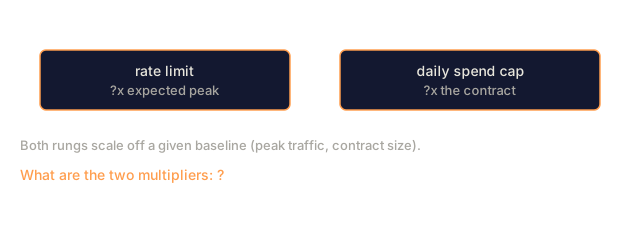
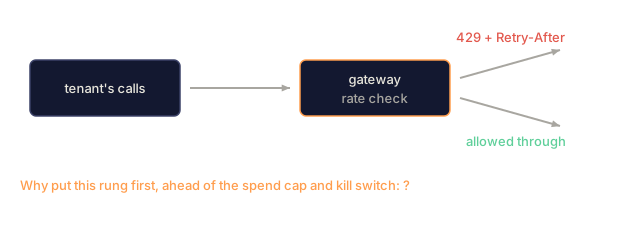
  1. Rate limit per tenant. 2-3x expected peak. Return 429 with Retry-After. The tenant sees friction instead of a surprise bill.

  2. Daily spend cap per tenant. 1.5-3x contracted ceiling. Trigger: tighten rate limit + alert customer-success.

  3. Kill switch on spend z-score > 4 relative to tenant baseline. Auto-pause tenant; page on-call; escalate to ops + CS.

Attribution patterns

  • Tag-and-aggregate: stamp metadata headers and aggregate later. Simple, but rough.
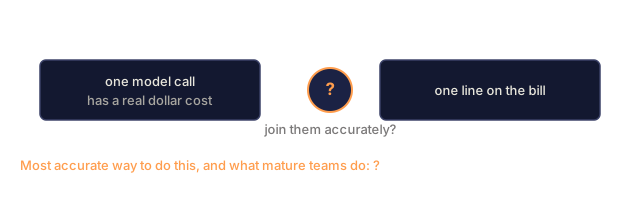
  • Telemetry joiner: join traces to billing via trace IDs. The most accurate option, and what mature teams do.
  • Sampling + extrapolation: sample 5-10%, multiply. Cheap for a rough number, but it misses the tails.
  • Model-based allocation: regression to infer cost driver. Use it for legacy data without tags.
  • Event-sourced: cost as events in a stream (Kafka / Kinesis), so you get it in real time.
  • Real-time streaming: the dashboard updates in under a second.

Cost per X is the unit metric

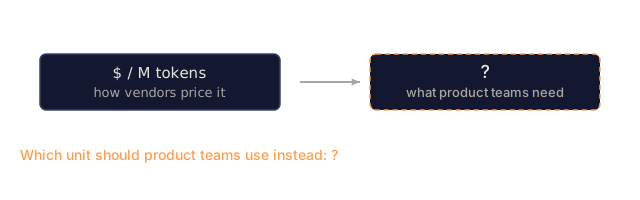
$/M tokens is how vendors price things. Product teams need a different unit:

  • Cost per resolved support ticket.
  • Cost per generated article.
  • Cost per successful agent task.
  • Cost per user-session-minute.

Tie cost to a product outcome, or you have nothing to anchor optimization to.

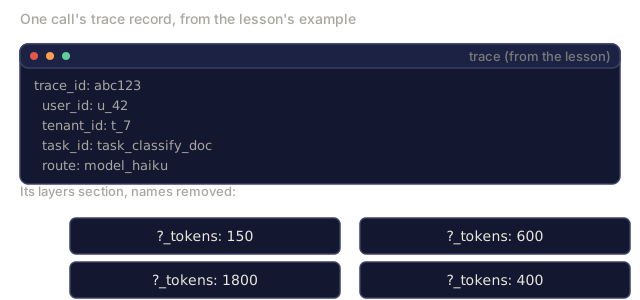
Cost attribution trace shape

trace_id: abc123
  user_id: u_42
  tenant_id: t_7
  task_id: task_classify_doc
  route: model_haiku
  layers:
    prompt_tokens: 1800
    tool_tokens: 600
    memory_tokens: 400
    response_tokens: 150
  cost_usd: 0.0135
  cached_input: true
  batch: false

Emit it on each call, store it in a data lake, and aggregate per dimension. It lives in the Phase 17 · 13 observability stack.

The compounded-savings stack

Four levers stack: cache, batch, route, and gateway. With all four:

  • Cache L2 (Phase 17 · 14): ~10x cheaper input.
  • Batch (Phase 17 · 15): 50% off.
  • Route to cheap model (Phase 17 · 16): 60% cost reduction.
  • Gateway efficiency (Phase 17 · 19): redundancy + retries.

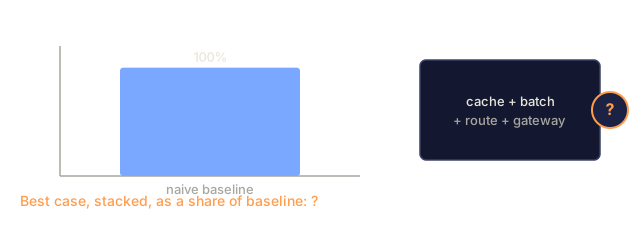
Best case, the stack lands at ~5-10% of the naive baseline. Most teams have 2-3 levers engaged, and few stack all four.

Numbers you should remember

  • Attribution dimensions: per-user, per-task, per-tenant.
  • Four token layers: prompt, tool, memory, response.
  • Kill switch: spend z-score > 4.
  • Unit metric: cost per resolved query, not $/M tokens.
  • Stacked optimizations: ~5-10% of baseline possible.
Check: The Concept0/22
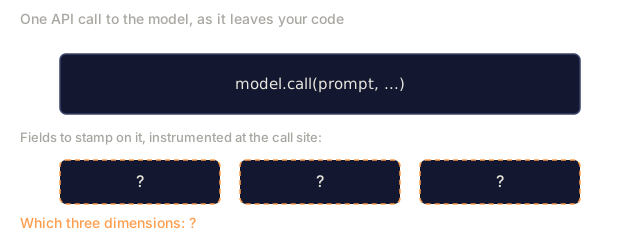
1. Which three attribution dimensions should you instrument on day one?Define
A single model.call line with three blank dashed tags beneath it to stamp at the call site. A line asks which three dimensions these are.
Setup: one outgoing call and three empty tag slots. The three dimension names are left blank.
2. What is per-user attribution in an LLM cost schema?Define
A card naming per-user attribution and setting it alongside per-task and per-tenant as the three attribution dimensions. A line asks what per-user attribution is.
Setup: the term, among its two sibling dimensions. What it actually means stays open.
3. Under per-task attribution, which fields identify the product surface that incurred a call?Define
A card naming per-task attribution and setting it alongside per-user and per-tenant as the three attribution dimensions. A line asks which fields identify the product surface.
Setup: the term, among its two sibling dimensions. Which fields it uses stays open.
4. What question does per-tenant attribution answer?Define
A card naming per-tenant attribution and setting it alongside per-user and per-task as the three attribution dimensions. A line asks what question per-tenant attribution answers.
Setup: the term, among its two sibling dimensions. What question it answers stays open.
5. What are the four token layers in the cost attribution schema?Define
A real trace record with trace, user, tenant, task and route fields filled in, followed by a layers section arranged as four boxes in a two by two grid, each reading a blank name underscore tokens, with values 150, 600, 1800 and 400 placed out of their usual reading order.
Trace fields and token counts from the lesson's own example. The four layer names are masked and their order is shuffled.
6. What is the rate limit rung of the enforcement ladder?Define
A card naming the rate limit as the first rung of a three-rung ladder, before the daily spend cap and the kill switch. A line asks what this rung does.
Setup: the term and its place in the ladder. What it actually does, and any threshold, stays open.
7. What does the daily spend cap do in the enforcement ladder?Define
A card naming the daily spend cap as the second rung of the ladder, after the rate limit and before the kill switch. A line asks what this rung does.
Setup: the term and its place in the ladder. What it actually does, and any threshold, stays open.
8. What triggers the kill switch in the enforcement ladder?Define
A card naming the kill switch as the third rung of the ladder, after the rate limit and the daily spend cap. A line asks what triggers this rung.
Setup: the term and its place in the ladder. What actually triggers it stays open.
9. Which attribution pattern is described as the most accurate, and what mature teams do?Define
A model call box and a billing-line box on either side of a question mark asking how to join them accurately. A line asks for the most accurate way to do this, and what mature teams do.
Setup: the two ends that need joining. No attribution pattern is named.
10. Which unit metric should product teams use instead of $/M tokens?Define
A box reading dollars per million tokens, labelled how vendors price it, with an arrow to a dashed blank box labelled what product teams need. A line asks which unit product teams should use instead.
Setup: the vendor unit the stem names. The product team's own unit is left blank.
11. When cache, batch, routing, and gateway levers are all stacked, what is the best case?Define
A single bar at 100 percent labelled naive baseline next to a box naming the four stacked levers, cache, batch, route and gateway, with a question mark where the resulting share would go. A line asks for the best case, stacked, as a share of baseline.
Setup: the naive baseline at 100 percent and the four lever names the stem gives. The resulting share is left blank.
12. What are the thresholds for the first two rungs of the enforcement ladder?Define
Two boxes, rate limit scaled by an unknown multiple of expected peak, and daily spend cap scaled by an unknown multiple of the contract. A line asks what the two multipliers are.
Setup: the two rungs and what each scales against. Both multipliers are left blank.
13. Why break spend into prompt, tool, memory, and response layers instead of reporting one token total?Explain
A single box for one token total on the left and four small unlabeled dashed boxes arranged in a grid on the right, for the same call's cost. A line asks why split it out instead of reporting one number.
Setup: one lumped total against the same cost split into unnamed parts, with no layer names shown.
14. Why does the ladder start with a rate limit that returns 429 with Retry-After?Explain
A tenant's calls flowing into a gateway rate check that branches either to a 429 with Retry-After or to being allowed through. A line asks why this rung comes first, ahead of the spend cap and kill switch.
Setup: the rate check and its two branches, both already named. Why it goes first stays open.
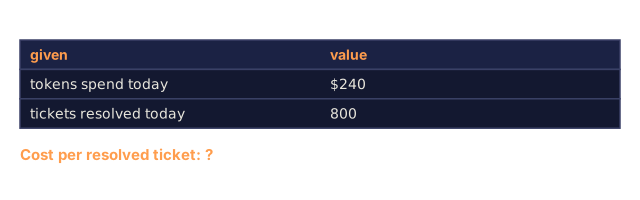
15. A support product spends $240 on tokens in one day and resolves 800 tickets. What is its cost per resolved ticket?Apply
A two-row table giving a support product's spend today, 240 dollars, and tickets resolved today, 800, with a line asking for the cost per resolved ticket.
Values from the stem.
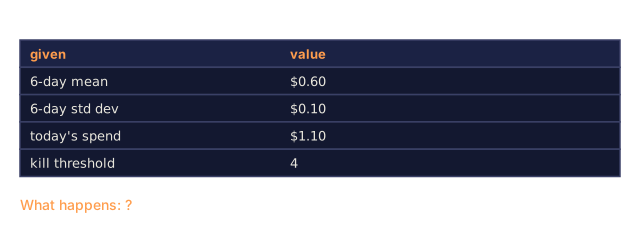
16. A tenant's history has a mean of $0.60 and a standard deviation of $0.10 over six days. Today it spends $1.10 against a kill threshold of 4. What happens?Apply
A four-row table giving a tenant's six-day mean of 0.60 dollars, standard deviation of 0.10 dollars, today's spend of 1.10 dollars, and a kill threshold of 4. A line asks what happens.
Values from the stem.
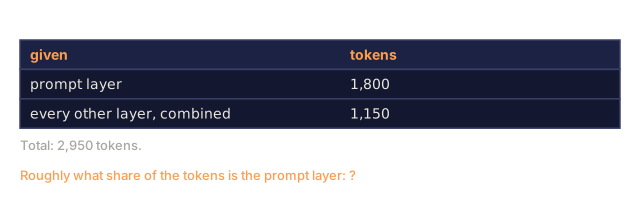
17. In the example trace, the layers are prompt 1800, tool 600, memory 400, and response 150 tokens. Roughly what share of the call's tokens is the prompt layer?Apply
A two-row table giving the prompt layer's 1,800 tokens against every other layer combined at 1,150 tokens, with a total of 2,950. A line asks roughly what share of the tokens is the prompt layer.
Values from the lesson's own example trace; the other three layers are combined into one figure rather than listed by name.
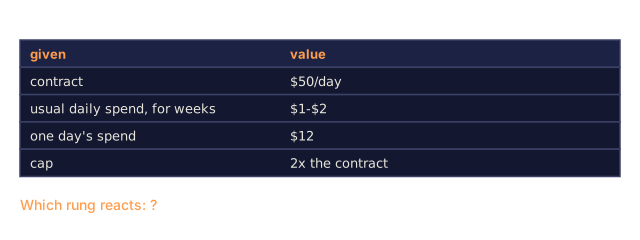
18. A tenant on a $50/day contract has spent $1-$2 a day for weeks, then jumps to $12 in one day. The cap is 2x the contract. Which rung fires?Apply
A four-row table giving a tenant's 50 dollar daily contract, a usual daily spend of 1 to 2 dollars held for weeks, one day's spend of 12 dollars, and a cap set at 2 times the contract. A line asks which rung reacts.
Values from the stem.
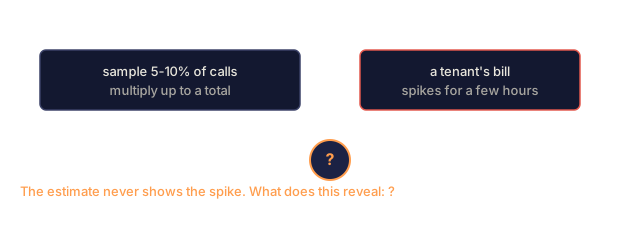
19. Your team estimates per-tenant cost by sampling 5-10% of calls and multiplying up. A tenant's bill spikes for a few hours and the estimate never shows it. What does this reveal?Analyze
A box describing sampling 5 to 10 percent of calls and multiplying up, next to a box describing a tenant's bill that spikes for a few hours, with a question mark between them. A line says the estimate never shows the spike and asks what this reveals.
Setup: the given sampling method and the given spike, with no named pattern.
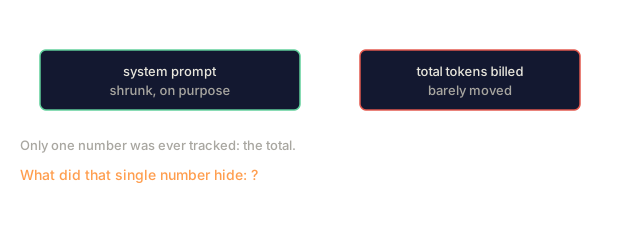
20. Spend keeps rising, so a team shrinks the system prompt, but the bill barely moves. They tracked a single token total. What did that single bucket hide?Analyze
A box showing the system prompt shrunk on purpose next to a box showing the total tokens billed barely moved, with a note that only one number was ever tracked. A line asks what that single number hid.
Setup: the given shrink and the given total. What the one bucket conceals is left blank.
21. You launch a multi-tenant product where contracts range from $30 to $200 a day. Which enforcement design fits the lesson's ladder?Design
A single box stating that contracts range from 30 to 200 dollars a day, with a line asking which enforcement design fits the lesson's ladder.
Setup: the given contract range only. No ladder design is drawn.
22. A new agent product must show which customers and features are profitable and what each task costs. Which plan fits?Design
A card stating that a new agent product must show which customers and features are profitable, and what each task costs. A line asks which plan fits.
Setup: the given requirements only. No attribution plan is drawn.

Use It

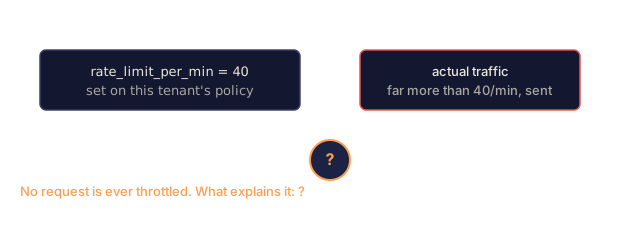
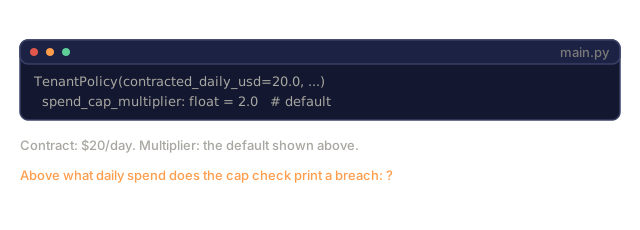
main.py simulates a multi-tenant LLM service with three tenants over 10 days: a normal one, a growing one, and one with 25x the traffic multiplier. It models the daily spend cap (a printed alert) and the z-score kill switch. The per-tenant rate_limit_per_min is defined on the policy but nothing enforces it, so the first rung of the ladder is only a field here.
Check: Use It0/6
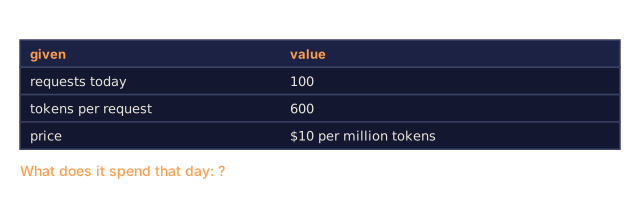
1. In main.py a normal tenant sends 100 requests a day at 600 tokens each, priced at $10 per million tokens. What does it spend that day?Apply
A three-row table giving a normal tenant's requests today, 100, tokens per request, 600, and price, 10 dollars per million tokens, with a line asking what it spends that day.
Values from the stem.
2. In main.py, tenant_C_abusive has a $20 contracted daily spend and the default cap multiplier of 2.0. Above what daily spend does the cap check print a breach?Apply
The real TenantPolicy line for a 20 dollar contract and the dataclass's default spend cap multiplier of 2.0 from main.py. A line asks above what daily spend the cap check prints a breach.
Fields quoted from the lesson's main.py.
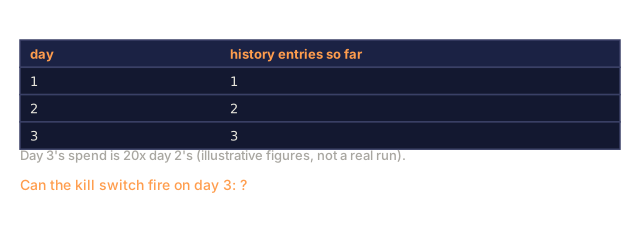
3. On day 3 of the simulation a tenant's spend jumps 20x over day 2. Can the kill switch fire?Apply
A three-row table showing the number of history entries collected by day 1, 2 and 3, each day adding one entry, with a note that day 3's spend is 20 times day 2's. A line asks whether the kill switch can fire on day 3.
History-entry counts follow directly from one entry per day; the 20x jump is an illustrative premise from the stem, not a captured run.
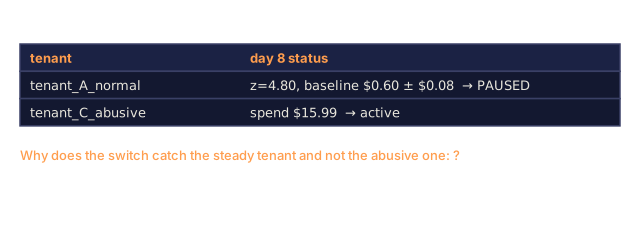
4. Running main.py, the kill switch pauses tenant_A_normal on day 8 while tenant_C_abusive keeps running. Why?Analyze
A table showing day 8 of the real run, tenant_A_normal at z equals 4.80 against a baseline of 0.60 plus or minus 0.08 dollars, paused, next to tenant_C_abusive at 15.99 dollars, still active. A line asks why the switch catches the steady tenant and not the abusive one.
Captured from a real run of the lesson's main.py.
5. In main.py a tenant with rate_limit_per_min=40 sends far more than that per minute, yet no request is ever throttled. What explains it?Analyze
A box showing rate_limit_per_min set to 40 on a tenant's policy, next to a box showing actual traffic far above 40 per minute, with a question mark between them. A line says no request is ever throttled and asks what explains it.
The field name and value are quoted from main.py's TenantPolicy.
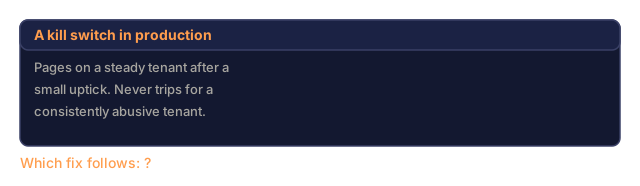
6. Your kill switch pages on a steady tenant after a small uptick, while a consistently abusive tenant never trips it. Which fix follows from the lesson's reasoning?Design
A card stating that a kill switch pages on a steady tenant after a small uptick, and never trips for a consistently abusive tenant. A line asks which fix follows.
Setup: the given symptom only. Neither the cause nor any fix is drawn.

Ship It

This lesson produces outputs/skill-finops-plan.md. Given product and scale, designs the attribution schema and enforcement ladder.

Author's Note

I'd run main.py before trusting the ladder, because the output surprised me. The kill switch fires on tenant_A_normal on day 8, at z=4.80, and the abusive tenant keeps running. Spend runs from about $0.50 a day for the normal tenant to $9-$22 a day for the abusive one, against contracts of $20 to $100. The cap is 2x the contract, so no tenant ever crosses it and the cap check never prints a breach either.

The reason is in how the z-score works. The baseline is the tenant's own five-plus days of history, and a steady tenant has a tiny standard deviation (about $0.08 around $0.60 for the normal one). A small, ordinary uptick then looks like a huge outlier. A tenant that is consistently abusive has a baseline that already includes the abuse, so nothing deviates from it. That is why the body says the threshold is relative to the tenant's own baseline, and why the cap and the rate limit exist as separate rungs.

So my bet is that the z-score kill switch needs a floor on absolute spend or a minimum standard deviation before it can page anyone, and the cap should be measured against the contract, not just history. Exercise 1 is the place to try that. The rate limit isn't enforced in the code at all, so treat the simulator as a sketch of the cap and kill-switch logic, not a working gateway.

Exercises

  1. Run main.py. Which tenant does the kill switch pause, at what z-score, and why? How do you pick the threshold?
  2. Design a per-tenant, per-task cost dashboard. What are the 5 views you build first?
  3. Your largest tenant is unit-economics-negative. Propose three interventions ordered by customer impact.
  4. Compute cost per resolved ticket for a support product: 3M tokens/ticket, ~800 tickets/day, GPT-5 cached rate.
  5. Argue whether retroactive tagging can ever work. When is it acceptable?

Key Terms

TermWhat people sayWhat it actually means
Per-user attribution"user-level cost"user_id stamped on every call
Per-task attribution"feature cost"task_id + route identify product surface
Per-tenant attribution"customer cost"tenant_id; drives unit economics
Four token layers"cost layers"prompt + tool + memory + response
Rate limit"429 guard"Per-tenant ceiling enforced at gateway
Daily spend cap"daily ceiling"Tenant-scoped budget with alert
Kill switch"auto-pause"Spend z-score > 4 triggers auto-suspension
Cost per resolved"product unit metric"Cost tied to product outcome, not tokens
Telemetry joiner"trace-to-billing"Highest-accuracy attribution pattern
Stacked optimization"cache+batch+route+gateway"Compounding savings to ~5-10% baseline

Further Reading

Code

Ships With