Unsupervised Learning
No labels, no teacher, no answer key. The algorithm has to find its own structure in the data.
Learning Objectives
- Implement K-Means, DBSCAN, and Gaussian Mixture Models from scratch and compare their clustering behavior
- Evaluate cluster quality using the silhouette score and the elbow method to select the optimal K
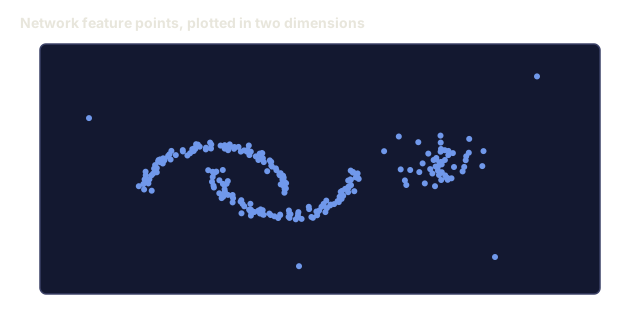
- Explain when DBSCAN outperforms K-Means and identify which algorithm handles non-spherical clusters and outliers
- Build an anomaly detection pipeline using clustering methods to flag points that deviate from normal patterns
The Problem
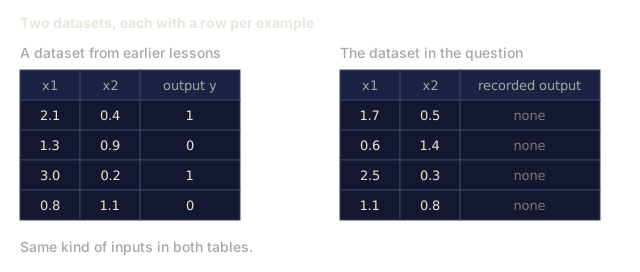
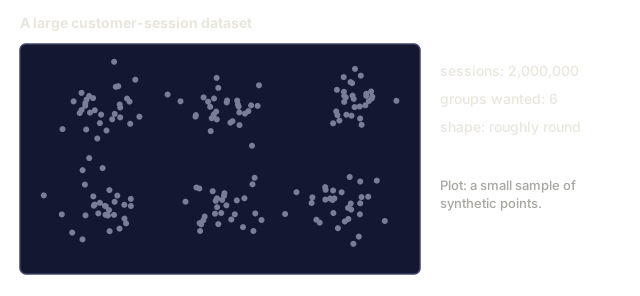
Every lesson up to this point has assumed labeled data: here's an input, here's the correct output. Out in the real world, that's the expensive part. A hospital sits on millions of patient records nobody has tagged with a diagnosis. An e-commerce site logs millions of sessions with no hand-labeled customer segments anywhere in sight, and a security team can stare at years of network traffic without a single confirmed example of what "anomaly" looks like on their own systems.
Unsupervised learning is what you reach for when there's no answer key: an algorithm that finds patterns without being told what to look for, grouping similar points, surfacing hidden structure, flagging what doesn't belong. Supervised learning is studying from a textbook with the answers already in the back. Unsupervised learning is staring at raw data until its shape becomes obvious.
The catch: without labels, there's no ground truth to check against. "Right" and "wrong" stop meaning anything, so you need an entirely different set of tools just to tell whether the structure you found is real, or something the algorithm imagined.
The Concept
Clustering: Grouping Similar Things Together
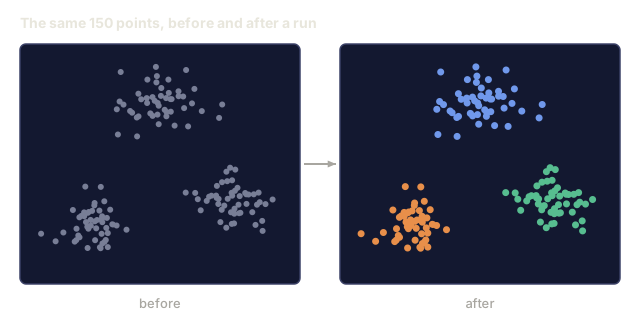
Clustering assigns every data point to a group, a cluster, so that points inside a group look more like each other than they look like points in any other group. The hard question is always what "similar" means.

K-Means: The Workhorse
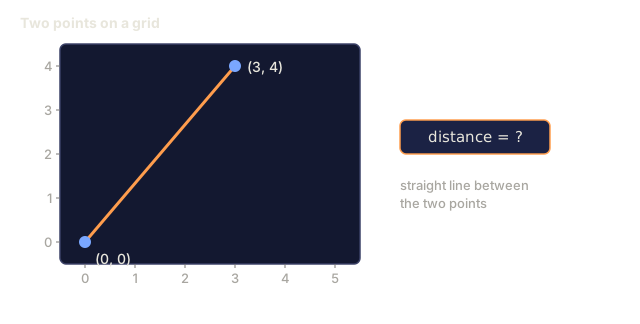
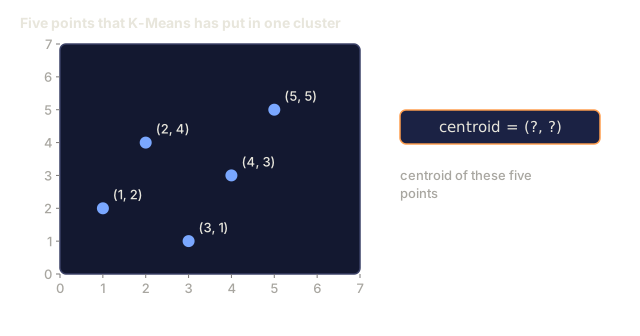
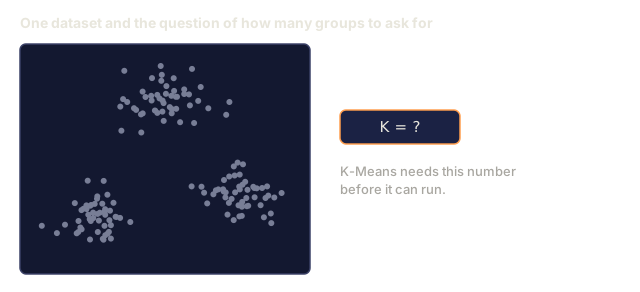
K-Means partitions the data into exactly K clusters. Each cluster gets a centroid, its center of mass, and every point belongs to whichever centroid sits closest.
Lloyd's algorithm:
- Pick K random points as initial centroids
- Assign each data point to the nearest centroid
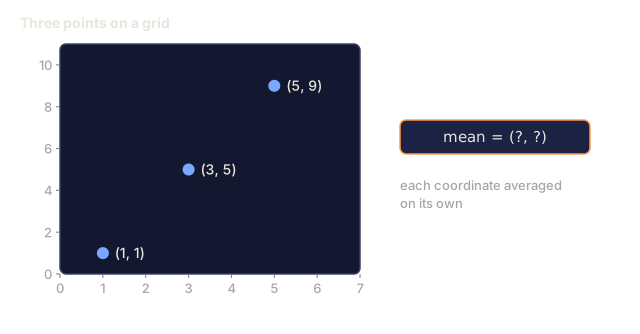
- Recompute each centroid as the mean of its assigned points
- Repeat steps 2-3 until assignments stop changing
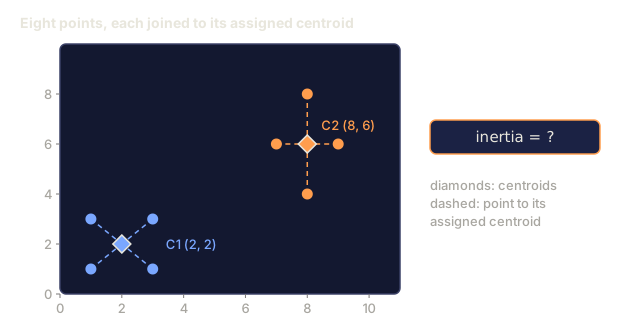
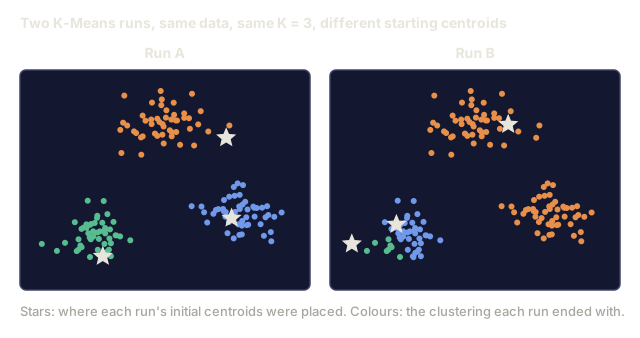
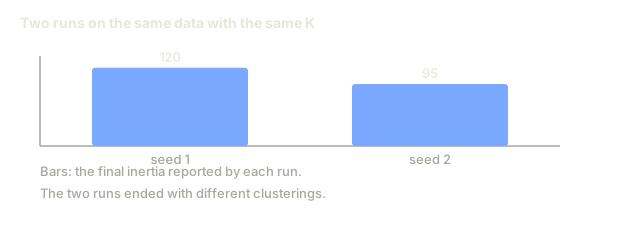
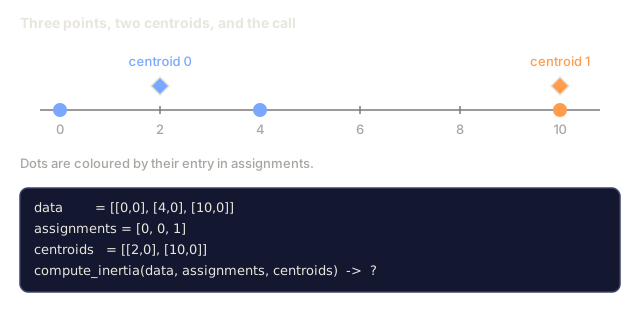
Inertia, the objective function K-Means minimizes, is the total squared distance from each point to its assigned centroid. K-Means only ever finds a local minimum of that objective, never the global one, so two different random initializations can converge to two different clusterings.
Choosing K
There are two standard ways to pick K.
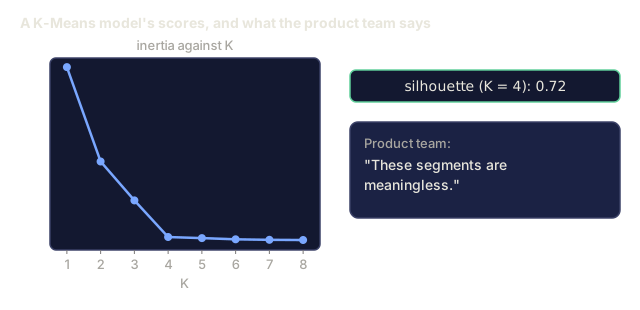
Elbow method: run K-Means for K = 1, 2, 3, ..., n, plot inertia against K, and look for the "elbow": the point where adding another cluster stops buying you much reduction in inertia.
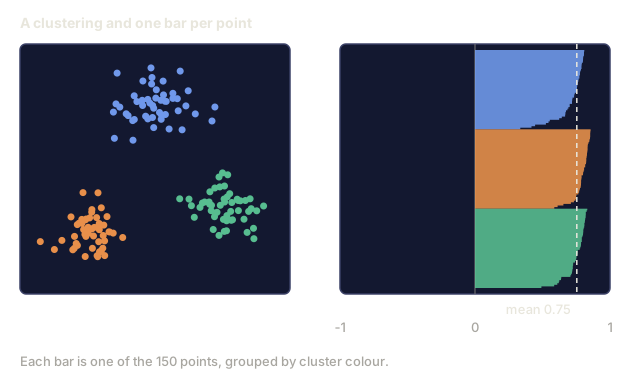
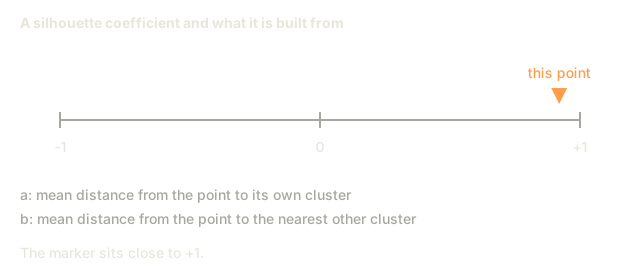
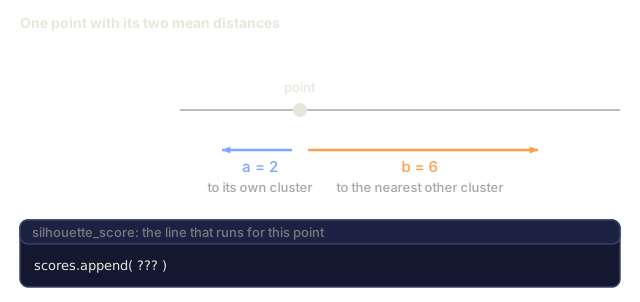
Silhouette score: for each point, compare how similar it is to its own cluster (a) against the nearest other cluster (b). The silhouette coefficient is (b - a) / max(a, b), running from -1 (you're in the wrong cluster) to +1 (well-clustered). Average that across every point and you get one global score for the whole clustering.
DBSCAN: Density-Based Clustering
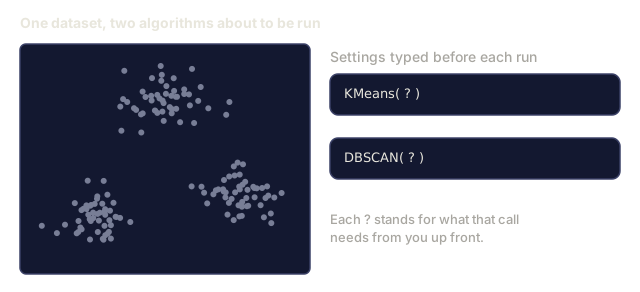
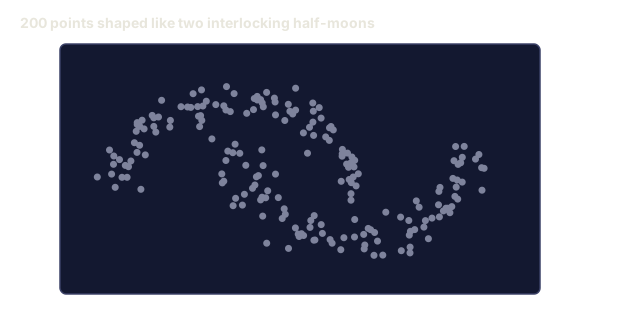
DBSCAN finds clusters as dense regions separated by sparse ones, so unlike K-Means, it never assumes clusters are round and never makes you commit to a K upfront.
Two parameters drive it:
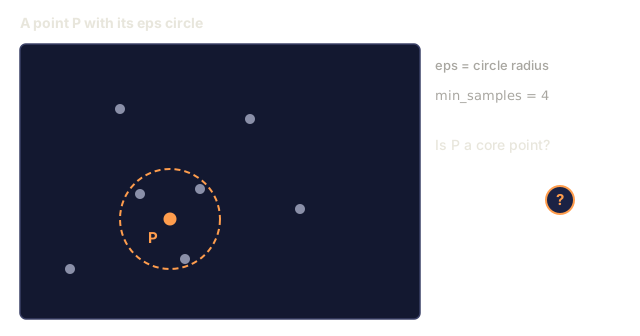
- eps: the radius of a neighborhood
- min_samples: the minimum number of points needed to call that neighborhood dense
Three kinds of points fall out of that:
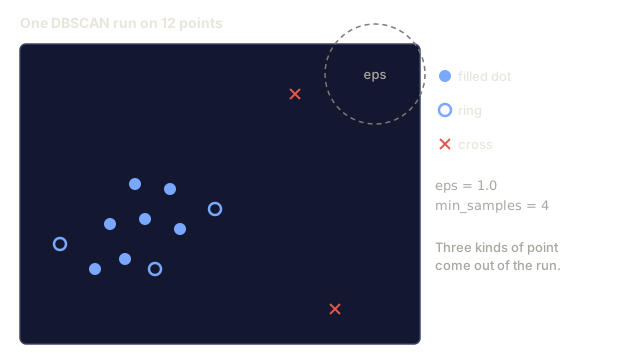
- Core point: has at least min_samples points within eps distance
- Border point: within eps of a core point but not itself a core point
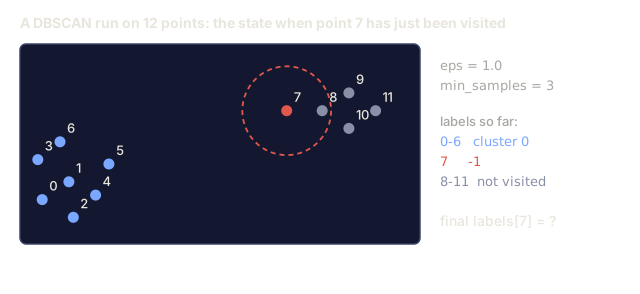
- Noise point: neither core nor border. These are outliers.
DBSCAN chains core points that are within eps of each other into a single cluster, lets border points tag along with the nearest core point's cluster, and leaves noise points in no cluster at all.
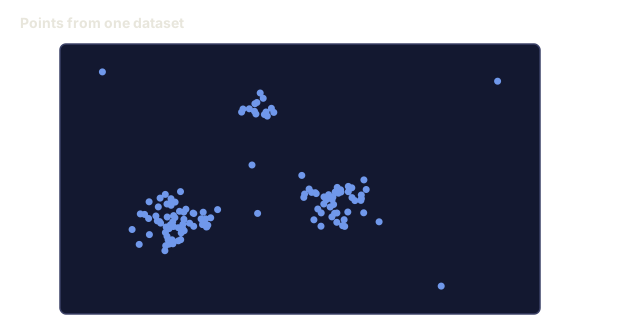
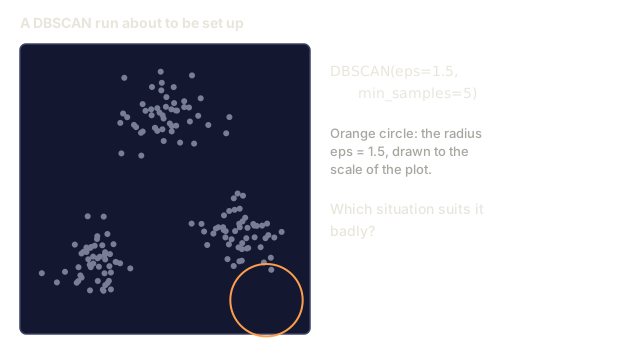
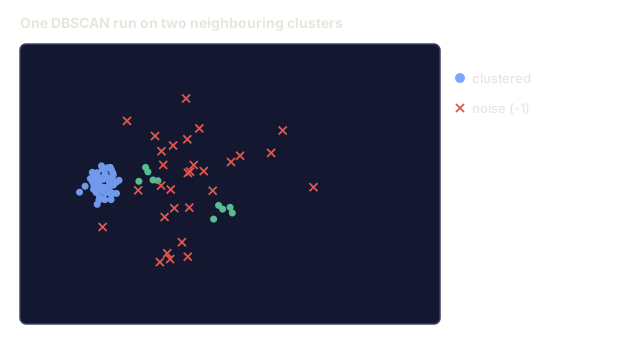
Its strength is finding clusters of any shape while working out the number of clusters and the outliers on its own. Its weakness shows up with clusters of very different densities: a single eps that's right for a tight cluster will swallow or miss a looser one sitting nearby.
Hierarchical Clustering
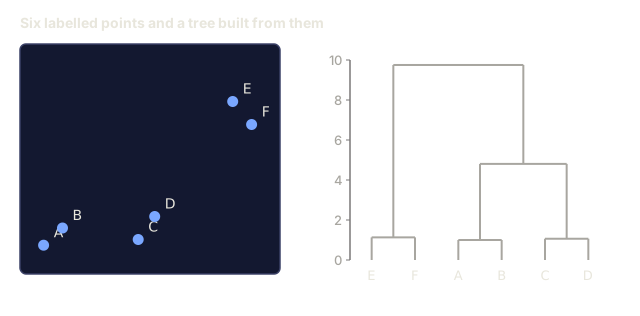
Hierarchical clustering builds a tree, a dendrogram, of nested clusters instead of committing to one flat partition.
Agglomerative (bottom-up):
- Start with each point as its own cluster
- Merge the two closest clusters
- Repeat until only one cluster remains
- Cut the dendrogram at the desired level to get K clusters
The "closeness" between clusters can be measured as:
- Single linkage: minimum distance between any two points in the two clusters
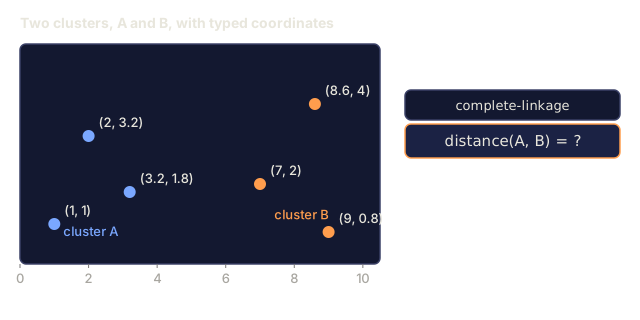
- Complete linkage: maximum distance between any two points
- Average linkage: average distance between all pairs
- Ward's method: the merge that causes the smallest increase in total within-cluster variance
Gaussian Mixture Models (GMM)
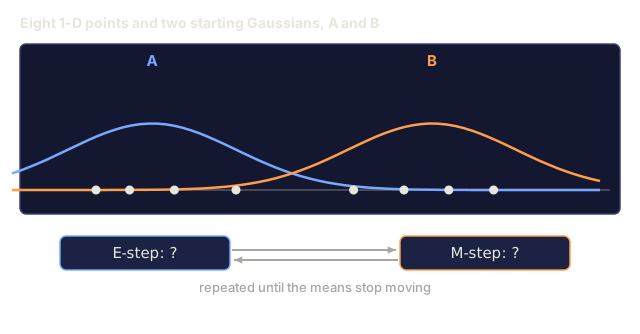
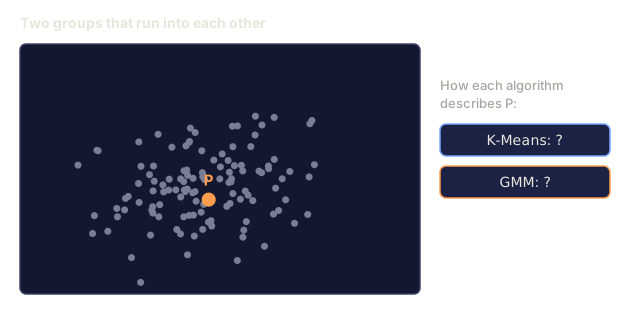
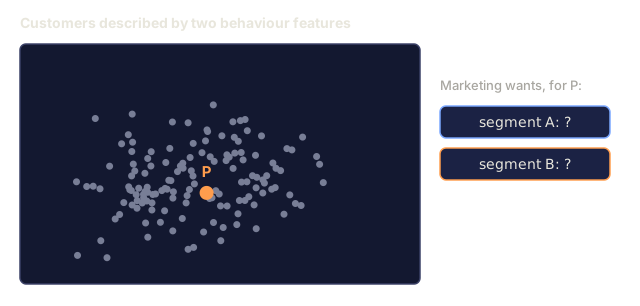
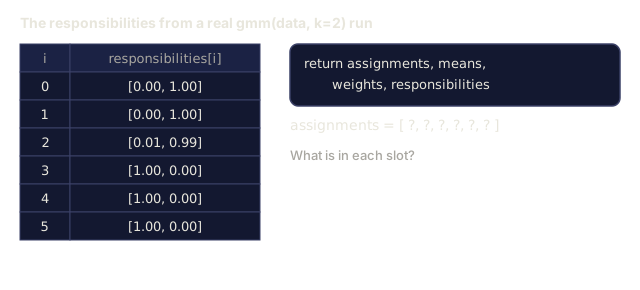
GMM gives soft assignments: instead of forcing each point into exactly one cluster the way K-Means does, it gives every point a probability of belonging to each cluster.
Under the hood, GMM assumes the data was generated by a mixture of K Gaussian distributions, each with its own mean and covariance. Fitting it means running Expectation-Maximization (EM), which alternates between:
- E-step: compute the probability that each point belongs to each Gaussian
- M-step: update the mean, covariance, and mixing weight of each Gaussian to maximize the likelihood of the data
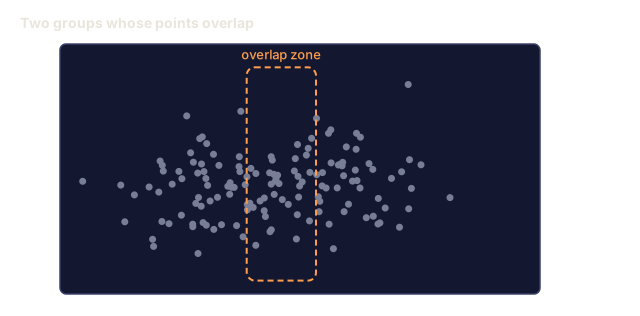
Because each Gaussian carries its own covariance, GMM can stretch its clusters into ellipses instead of K-Means's spheres, and it handles overlapping clusters naturally: a point near the boundary just gets a mixed probability instead of an arbitrary hard call.
When to Use Which
Line these up and the choice usually falls out fast:
| Method | Best for | Avoid when |
|---|---|---|
| K-Means | Large datasets, spherical clusters, known K | Irregular shapes, outliers present |
| DBSCAN | Unknown K, arbitrary shapes, outlier detection | Varying densities, very high dimensions |
| Hierarchical | Small datasets, need dendrogram, unknown K | Large datasets (O(n^2) memory) |
| GMM | Overlapping clusters, soft assignments needed | Very large datasets, too many dimensions |
Anomaly Detection with Clustering
Clustering gives you anomaly detection for free, once you know where to look:
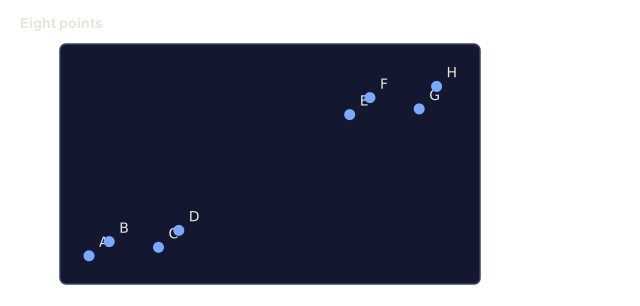
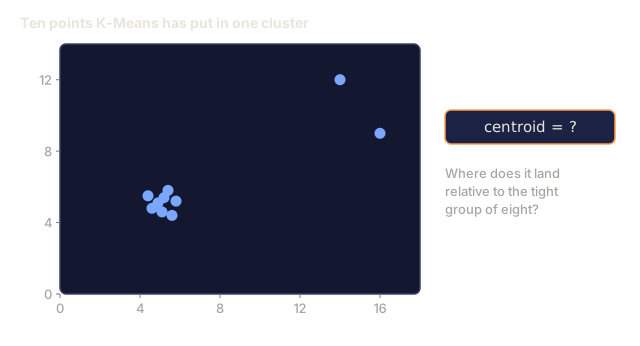
- K-Means: points far from any centroid are anomalies
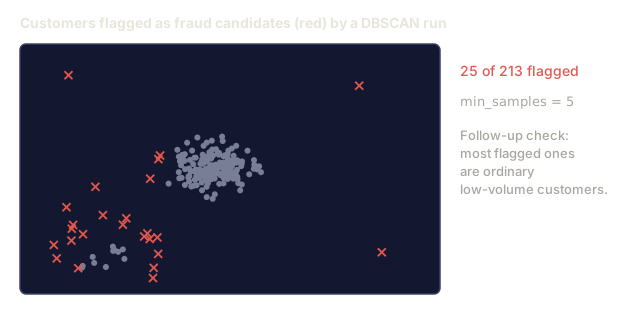
- DBSCAN: noise points are anomalies by definition
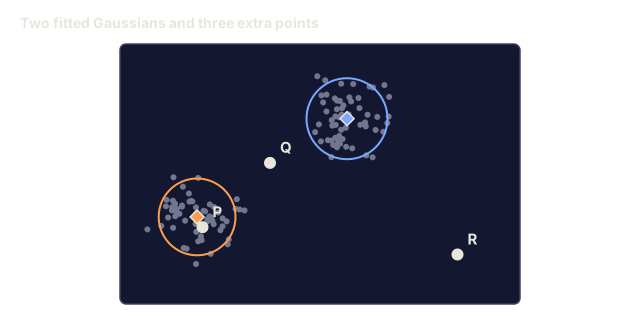
- GMM: points with low probability under all Gaussians are anomalies
Build It
Step 1: K-Means from scratch
import math
import random


def euclidean_distance(a, b):
    return math.sqrt(sum((ai - bi) ** 2 for ai, bi in zip(a, b)))


def kmeans(data, k, max_iterations=100, seed=42):
    random.seed(seed)
    n_features = len(data[0])

    centroids = random.sample(data, k)

    for iteration in range(max_iterations):
        clusters = [[] for _ in range(k)]
        assignments = []

        for point in data:
            distances = [euclidean_distance(point, c) for c in centroids]
            nearest = distances.index(min(distances))
            clusters[nearest].append(point)
            assignments.append(nearest)

        new_centroids = []
        for cluster in clusters:
            if len(cluster) == 0:
                new_centroids.append(random.choice(data))
                continue
            centroid = [
                sum(point[j] for point in cluster) / len(cluster)
                for j in range(n_features)
            ]
            new_centroids.append(centroid)

        if all(
            euclidean_distance(old, new) < 1e-6
            for old, new in zip(centroids, new_centroids)
        ):
            print(f"  Converged at iteration {iteration + 1}")
            break

        centroids = new_centroids

    return assignments, centroids
Step 2: Elbow method and silhouette score
def compute_inertia(data, assignments, centroids):
    total = 0.0
    for point, cluster_id in zip(data, assignments):
        total += euclidean_distance(point, centroids[cluster_id]) ** 2
    return total


def silhouette_score(data, assignments):
    n = len(data)
    if n < 2:
        return 0.0

    clusters = {}
    for i, c in enumerate(assignments):
        clusters.setdefault(c, []).append(i)

    if len(clusters) < 2:
        return 0.0

    scores = []
    for i in range(n):
        own_cluster = assignments[i]
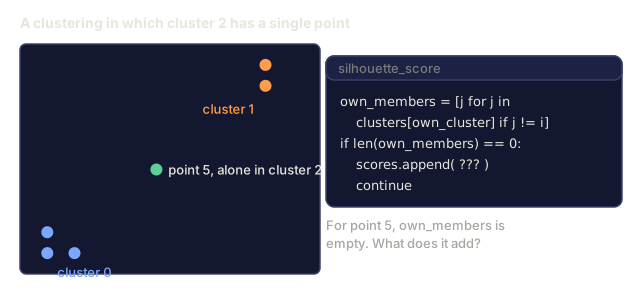
        own_members = [j for j in clusters[own_cluster] if j != i]

        if len(own_members) == 0:
            scores.append(0.0)
            continue

        a = sum(euclidean_distance(data[i], data[j]) for j in own_members) / len(own_members)

        b = float("inf")
        for cluster_id, members in clusters.items():
            if cluster_id == own_cluster:
                continue
            avg_dist = sum(euclidean_distance(data[i], data[j]) for j in members) / len(members)
            b = min(b, avg_dist)

        if max(a, b) == 0:
            scores.append(0.0)
        else:
            scores.append((b - a) / max(a, b))

    return sum(scores) / len(scores)


def find_best_k(data, max_k=10):
    print("Elbow method:")
    inertias = []
    for k in range(1, max_k + 1):
        assignments, centroids = kmeans(data, k)
        inertia = compute_inertia(data, assignments, centroids)
        inertias.append(inertia)
        print(f"  K={k}: inertia={inertia:.2f}")

    print("\nSilhouette scores:")
    for k in range(2, max_k + 1):
        assignments, centroids = kmeans(data, k)
        score = silhouette_score(data, assignments)
        print(f"  K={k}: silhouette={score:.4f}")

    return inertias
Step 3: DBSCAN from scratch
def dbscan(data, eps, min_samples):
    n = len(data)
    labels = [-1] * n
    cluster_id = 0

    def region_query(point_idx):
        neighbors = []
        for i in range(n):
            if euclidean_distance(data[point_idx], data[i]) <= eps:
                neighbors.append(i)
        return neighbors

    visited = [False] * n

    for i in range(n):
        if visited[i]:
            continue
        visited[i] = True

        neighbors = region_query(i)

        if len(neighbors) < min_samples:
            labels[i] = -1
            continue

        labels[i] = cluster_id
        seed_set = list(neighbors)
        seed_set.remove(i)

        j = 0
        while j < len(seed_set):
            q = seed_set[j]

            if not visited[q]:
                visited[q] = True
                q_neighbors = region_query(q)
                if len(q_neighbors) >= min_samples:
                    for nb in q_neighbors:
                        if nb not in seed_set:
                            seed_set.append(nb)

            if labels[q] == -1:
                labels[q] = cluster_id

            j += 1

        cluster_id += 1

    return labels
Step 4: Gaussian Mixture Model (EM algorithm)
def gmm(data, k, max_iterations=100, seed=42):
    random.seed(seed)
    n = len(data)
    d = len(data[0])

    indices = random.sample(range(n), k)
    means = [list(data[i]) for i in indices]
    variances = [1.0] * k
    weights = [1.0 / k] * k

    def gaussian_pdf(x, mean, variance):
        d = len(x)
        coeff = 1.0 / ((2 * math.pi * variance) ** (d / 2))
        exponent = -sum((xi - mi) ** 2 for xi, mi in zip(x, mean)) / (2 * variance)
        return coeff * math.exp(max(exponent, -500))

    for iteration in range(max_iterations):
        responsibilities = []
        for i in range(n):
            probs = []
            for j in range(k):
                probs.append(weights[j] * gaussian_pdf(data[i], means[j], variances[j]))
            total = sum(probs)
            if total == 0:
                total = 1e-300
            responsibilities.append([p / total for p in probs])

        old_means = [list(m) for m in means]

        for j in range(k):
            r_sum = sum(responsibilities[i][j] for i in range(n))
            if r_sum < 1e-10:
                continue

            weights[j] = r_sum / n

            for dim in range(d):
                means[j][dim] = sum(
                    responsibilities[i][j] * data[i][dim] for i in range(n)
                ) / r_sum

            variances[j] = sum(
                responsibilities[i][j]
                * sum((data[i][dim] - means[j][dim]) ** 2 for dim in range(d))
                for i in range(n)
            ) / (r_sum * d)
            variances[j] = max(variances[j], 1e-6)

        shift = sum(
            euclidean_distance(old_means[j], means[j]) for j in range(k)
        )
        if shift < 1e-6:
            print(f"  GMM converged at iteration {iteration + 1}")
            break

    assignments = []
    for i in range(n):
        assignments.append(responsibilities[i].index(max(responsibilities[i])))

    return assignments, means, weights, responsibilities
Step 5: Generate test data and run everything
def make_blobs(centers, n_per_cluster=50, spread=0.5, seed=42):
    random.seed(seed)
    data = []
    true_labels = []
    for label, (cx, cy) in enumerate(centers):
        for _ in range(n_per_cluster):
            x = cx + random.gauss(0, spread)
            y = cy + random.gauss(0, spread)
            data.append([x, y])
            true_labels.append(label)
    return data, true_labels


def make_moons(n_samples=200, noise=0.1, seed=42):
    random.seed(seed)
    data = []
    labels = []
    n_half = n_samples // 2
    for i in range(n_half):
        angle = math.pi * i / n_half
        x = math.cos(angle) + random.gauss(0, noise)
        y = math.sin(angle) + random.gauss(0, noise)
        data.append([x, y])
        labels.append(0)
    for i in range(n_half):
        angle = math.pi * i / n_half
        x = 1 - math.cos(angle) + random.gauss(0, noise)
        y = 1 - math.sin(angle) - 0.5 + random.gauss(0, noise)
        data.append([x, y])
        labels.append(1)
    return data, labels


if __name__ == "__main__":
    centers = [[2, 2], [8, 3], [5, 8]]
    data, true_labels = make_blobs(centers, n_per_cluster=50, spread=0.8)

    print("=== K-Means on 3 blobs ===")
    assignments, centroids = kmeans(data, k=3)
    print(f"  Centroids: {[[round(c, 2) for c in cent] for cent in centroids]}")
    sil = silhouette_score(data, assignments)
    print(f"  Silhouette score: {sil:.4f}")

    print("\n=== Elbow Method ===")
    find_best_k(data, max_k=6)

    print("\n=== DBSCAN on 3 blobs ===")
    db_labels = dbscan(data, eps=1.5, min_samples=5)
    n_clusters = len(set(db_labels) - {-1})
    n_noise = db_labels.count(-1)
    print(f"  Found {n_clusters} clusters, {n_noise} noise points")

    print("\n=== GMM on 3 blobs ===")
    gmm_assignments, gmm_means, gmm_weights, _ = gmm(data, k=3)
    print(f"  Means: {[[round(m, 2) for m in mean] for mean in gmm_means]}")
    print(f"  Weights: {[round(w, 3) for w in gmm_weights]}")
    gmm_sil = silhouette_score(data, gmm_assignments)
    print(f"  Silhouette score: {gmm_sil:.4f}")

    print("\n=== DBSCAN on moons (non-spherical clusters) ===")
    moon_data, moon_labels = make_moons(n_samples=200, noise=0.1)
    moon_db = dbscan(moon_data, eps=0.3, min_samples=5)
    n_moon_clusters = len(set(moon_db) - {-1})
    n_moon_noise = moon_db.count(-1)
    print(f"  Found {n_moon_clusters} clusters, {n_moon_noise} noise points")

    print("\n=== K-Means on moons (will fail to separate) ===")
    moon_km, moon_centroids = kmeans(moon_data, k=2)
    moon_sil = silhouette_score(moon_data, moon_km)
    print(f"  Silhouette score: {moon_sil:.4f}")
    print("  K-Means splits moons poorly because they are not spherical")

    print("\n=== Anomaly detection with DBSCAN ===")
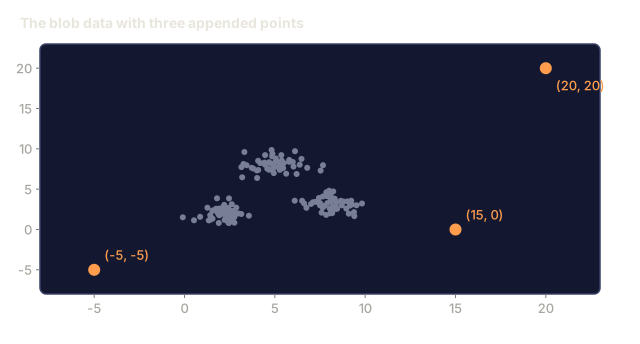
    anomaly_data = list(data)
    anomaly_data.append([20.0, 20.0])
    anomaly_data.append([-5.0, -5.0])
    anomaly_data.append([15.0, 0.0])
    anomaly_labels = dbscan(anomaly_data, eps=1.5, min_samples=5)
    anomalies = [
        anomaly_data[i]
        for i in range(len(anomaly_labels))
        if anomaly_labels[i] == -1
    ]
    print(f"  Detected {len(anomalies)} anomalies")
    for a in anomalies[-3:]:
        print(f"    Point {[round(v, 2) for v in a]}")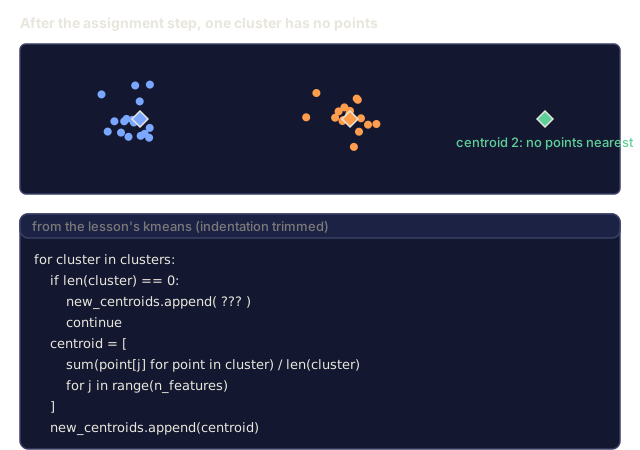
Use It
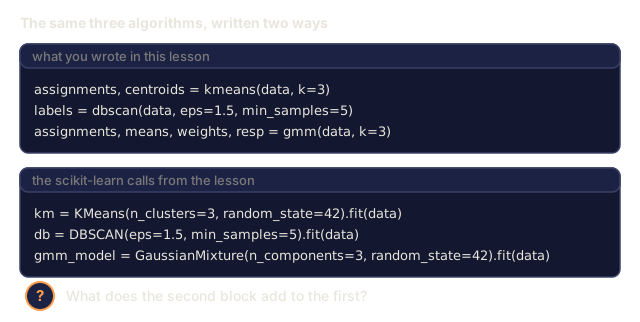
Every one of these algorithms is a one-liner in scikit-learn:
from sklearn.cluster import KMeans, DBSCAN, AgglomerativeClustering
from sklearn.mixture import GaussianMixture
from sklearn.metrics import silhouette_score as sklearn_silhouette

km = KMeans(n_clusters=3, random_state=42).fit(data)
db = DBSCAN(eps=1.5, min_samples=5).fit(data)
agg = AgglomerativeClustering(n_clusters=3).fit(data)
gmm_model = GaussianMixture(n_components=3, random_state=42).fit(data)
That's the whole point of building these from scratch first: now you know exactly what's happening inside each call. K-Means iterates between assigning points and recomputing centroids. DBSCAN grows clusters outward from dense seeds. GMM alternates between expectation and maximization. scikit-learn's versions add numerical stability, smarter initialization (K-Means++), and GPU acceleration on top, but the core logic you just wrote by hand is the core logic running underneath.
Ship It
This lesson ships two things you can reuse: working implementations of K-Means, DBSCAN, and GMM built from scratch, and outputs/skill-clustering-guide.md, a skill for choosing the right clustering algorithm based on data shape, noise, and the constraints you're working under.
The hard part of unsupervised learning isn't running the algorithm, it's deciding whether you should trust what it found. Silhouette score and the elbow method give you numbers, but numbers computed on ungrounded data can lie to you just as confidently as a person can. I've shipped a K-Means model with a great inertia curve and a lousy business outcome, because the metric was optimizing for tight, well-separated clusters, not clusters that meant anything to the team using them.
My rule of thumb: look at the actual points in each cluster before you look at any score, and get a domain expert to sanity-check whether the groups make sense. And if DBSCAN keeps calling half your data noise, that's not DBSCAN being picky. That's eps set too small for the density you actually have. Tune the parameter before you tune your expectations.
Exercises
- Implement K-Means++ initialization: instead of picking random centroids, pick the first randomly and each subsequent centroid with probability proportional to its squared distance from the nearest existing centroid. Compare convergence speed to random initialization.
- Add hierarchical agglomerative clustering to the code. Implement Ward's linkage and produce a dendrogram (as a nested list of merges). Cut it at different levels and compare to K-Means results.
- Build a simple anomaly detection pipeline: run DBSCAN and GMM on the same data, flag points that both methods agree are outliers (noise in DBSCAN, low probability in GMM). Measure the overlap and discuss when the methods disagree.
Key Terms
| Term | What people say | What it actually means |
|---|---|---|
| Clustering | "Grouping similar things" | Partitioning data into subsets where within-group similarity exceeds between-group similarity, measured by a specific distance metric |
| Centroid | "The center of a cluster" | The mean of all points assigned to a cluster; used by K-Means as the cluster representative |
| Inertia | "How tight the clusters are" | Sum of squared distances from each point to its assigned centroid; lower is tighter |
| Silhouette score | "How well-separated clusters are" | For each point, (b - a) / max(a, b) where a is mean intra-cluster distance and b is mean nearest-cluster distance |
| Core point | "A point in a dense region" | A point with at least min_samples neighbors within eps distance, in DBSCAN |
| EM algorithm | "Soft K-Means" | Expectation-Maximization: iteratively compute membership probabilities (E-step) and update distribution parameters (M-step) |
| Dendrogram | "A tree of clusters" | A tree diagram showing the order and distance at which clusters were merged in hierarchical clustering |
| Anomaly | "An outlier" | A data point that does not conform to the expected pattern, identified as noise by DBSCAN or low-probability by GMM |
Further Reading
- Stanford CS229 - Unsupervised Learning - Andrew Ng's lecture notes on clustering and EM
- scikit-learn Clustering Guide - practical comparison of all clustering algorithms with visual examples
- DBSCAN original paper (Ester et al., 1996) - the paper that introduced density-based clustering
Code
- clustering.py (python, 398 lines)