Load Testing LLM APIs — Why k6 and Locust Lie
Traditional load testers were not built for streaming responses, variable output lengths, token-level metrics, or GPU saturation. Two traps catch most teams. The GIL trap: Locust's token-level measurement runs tokenization under the Python GIL, where it competes with request generation under heavy concurrency. The tokenization backlog inflates reported inter-token latency, so the client is the bottleneck, not the server. The prompt-uniformity trap: identical prompts in a loop test one point on the token distribution, but real traffic has variable length and diverse prefix matches. LLMPerf handles this with `--mean-input-tokens` and `--stddev-input-tokens`. Tool mapping in 2026: LLM-specialized tools (GenAI-Perf, LLMPerf, LLM-Locust, guidellm) for token-level accuracy; **k6 v2026.1.0** with **k6 Operator 1.0 GA (Sept 2025)** for streaming-aware, Kubernetes-native distributed runs via TestRun/PrivateLoadZone CRDs, best for CI/CD gates; Vegeta for Go constant-rate saturation; Locust 2.43.3 only with the LLM-Locust extension for streaming. Load patterns: steady-state, ramp, spike (autoscaling test), soak (memory leaks).
Learning Objectives
- Explain the two anti-patterns (GIL trap, prompt-uniformity trap) that make generic load testers lie for LLM APIs.
- Pick a tool for a given purpose: LLMPerf (benchmark run), k6 + streaming extension (CI gate), guidellm (large-scale synthetic), GenAI-Perf (NVIDIA reference).
- Design four load patterns (steady, ramp, spike, soak) and name the failure mode each catches.
- Build a realistic prompt distribution using mean + stddev of input tokens rather than fixed length.
The Problem
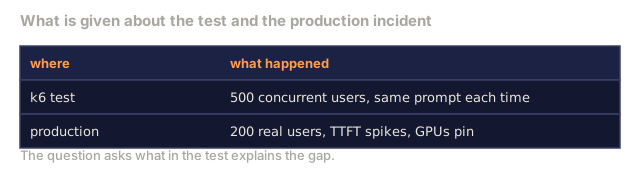
Say you k6-test your LLM endpoint at 500 concurrent users and it holds. You ship. In production, at 200 actual users, the service falls over: P99 TTFT explodes and the GPUs pin.
Two things went wrong. First, k6 sent 500 identical prompts, so request coalescing and prefix caching made it look like you were handling 500 concurrent decodes when you were actually handling one. Second, k6 does not track inter-token latency on streaming responses the way a reader experiences it. It sees one HTTP connection, not 500 tokens arriving at varying intervals.
Load testing for LLMs is its own discipline.
The Concept
The GIL trap (Locust)
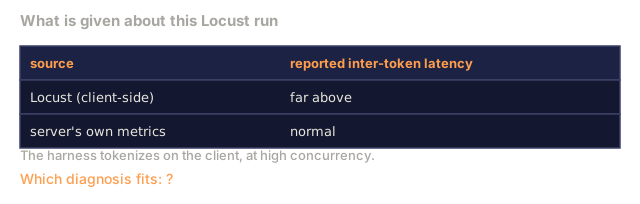
Locust is Python, and it runs tokenization client-side under the GIL. Under high concurrency the tokenizer queues behind request generation, and the reported inter-token latency includes that backlog. You think the server is slow when it's the test harness.
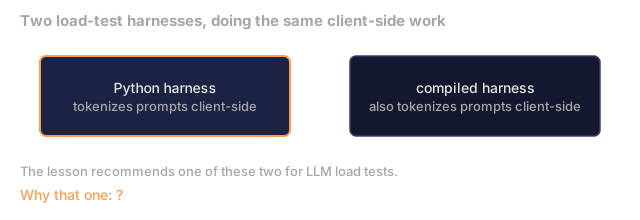
The fix is the LLM-Locust extension, which moves tokenization to separate processes, or a compiled-language harness (k6, or LLMPerf using tokenizers.rs).
The prompt-uniformity trap
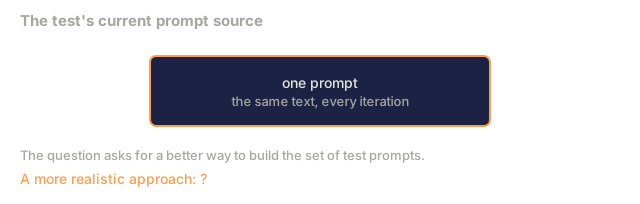
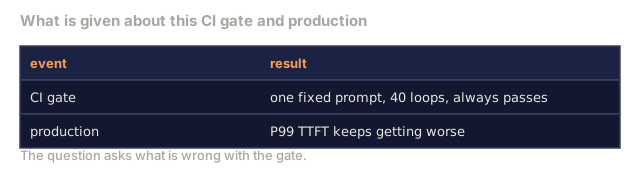
Most load testers make it easy to configure a single prompt. In a loop test of 10,000 iterations, that exact prompt goes out each time. The server sees the same prefix on every request, prefix cache hits approach 100%, and throughput looks great.
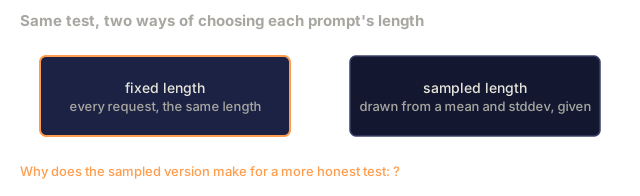
The fix is to sample from a prompt distribution. LLMPerf takes --mean-input-tokens 500 --stddev-input-tokens 150, which gives diverse lengths and diverse content.
Four load patterns
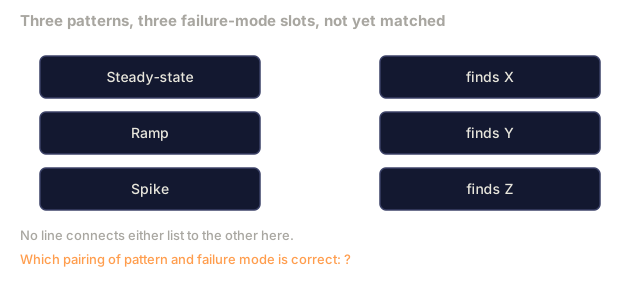
- Steady-state: constant RPS for 30-60 min. Catches baseline performance regressions.
- Ramp: linearly increase RPS from 0 to target over 15 min. Catches the capacity breakpoint and warm-up anomalies.
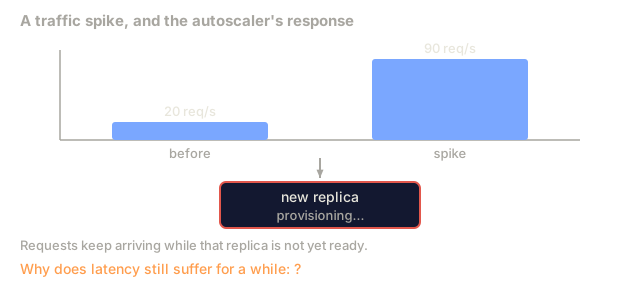
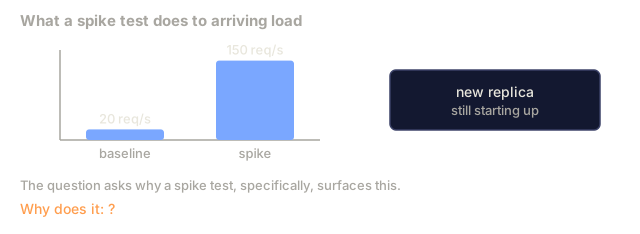
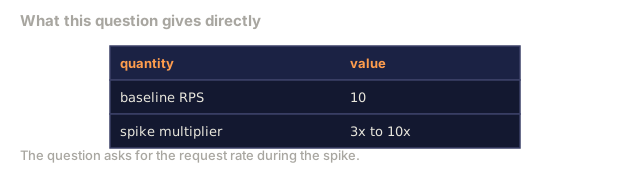
- Spike: a sudden 3-10x RPS for 2 min, then back. Catches autoscaling latency, queue saturation, and cold-start impact.
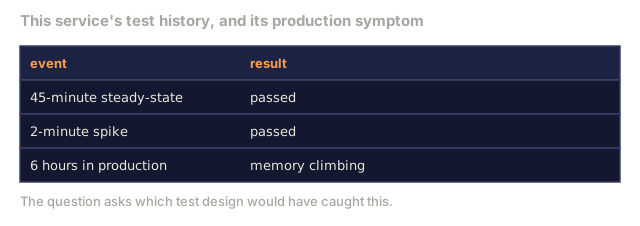
- Soak: steady-state for 4-8 hours. Catches memory leaks, connection-pool drift, and observability overflow.
2026 tool mapping
LLMPerf (Anyscale) is Python with Rust-backed tokenization. It samples mean/stddev prompts and is streaming-aware. It's the best default for performance runs.
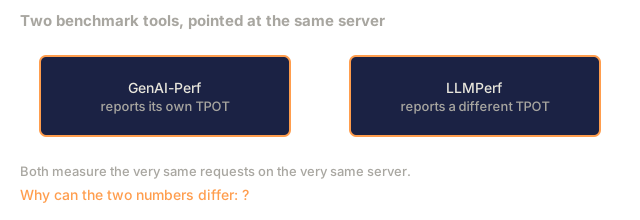
NVIDIA GenAI-Perf is NVIDIA's reference harness. It uses the Triton client and covers a wide range of metrics. Its ITL excludes TTFT while LLMPerf's includes it, so the two tools produce different TPOT for the same server.
LLM-Locust (TrueFoundry) is a Locust extension that fixes the GIL trap. You keep the familiar Locust DSL and get streaming metrics.
guidellm does large-scale synthetic benchmarking.
k6 v2026.1.0 + k6 Operator 1.0 GA (Sept 2025):
- k6 itself (Go, compiled, no GIL) added streaming-aware metrics.
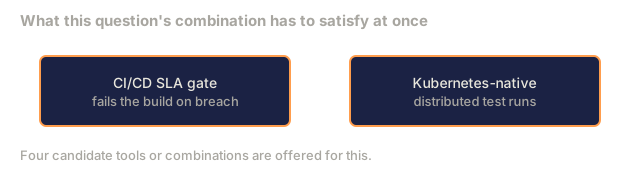
- The k6 Operator uses TestRun / PrivateLoadZone CRDs for Kubernetes-native distributed testing.
- Best for CI/CD gates and SLA testing.
Vegeta is Go and simpler than k6. It does constant-rate HTTP saturation. It isn't LLM-aware, but it works for gateway and rate-limit testing.
Locust 2.43.3 stock has the GIL trap for LLM work, so use it only with the LLM-Locust extension.
SLA gate in CI
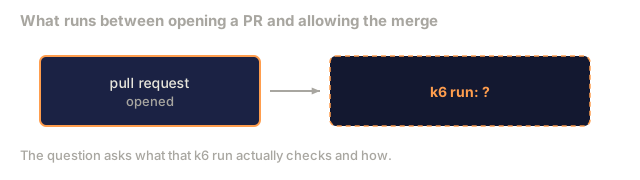
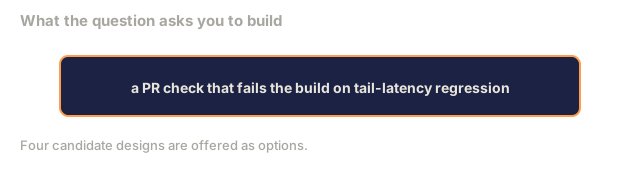
Run k6 on the PR with:
- 30-50 iterations at baseline RPS.
- Gate: P50/P95 TTFT, 5xx under 5%, TPOT under threshold.
- Break the build on breach.
Realistic prompt distribution
Build it from real traffic samples if you have them, or from published distributions (ShareGPT prompts for chat, HumanEval for code). Feed the mean and stddev to LLMPerf. Skip the loop with one prompt.
Numbers you should remember
- k6 Operator 1.0 GA: September 2025.
- k6 v2026.1.0: streaming-aware metrics.
- Typical LLMPerf run: 100-1000 requests at concurrency X.
- Typical CI gate: 30-50 iterations per PR.
- Four patterns: steady, ramp, spike, soak.
Use It
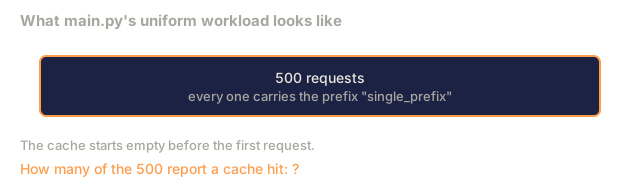
code/main.py simulates a load test with a uniform workload and a realistic prompt distribution, reports TTFT P50, P99, mean and cache hits for each, and demonstrates the uniform-prompt trap. It does not model TPOT.
Ship It
This lesson produces outputs/skill-load-test-plan.md. Given a workload and an SLA, it picks a tool and designs the four load patterns.
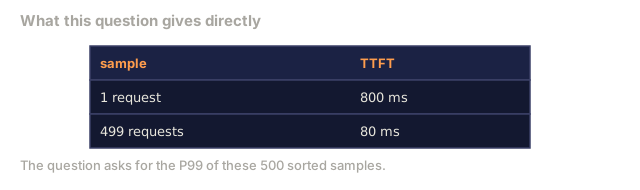
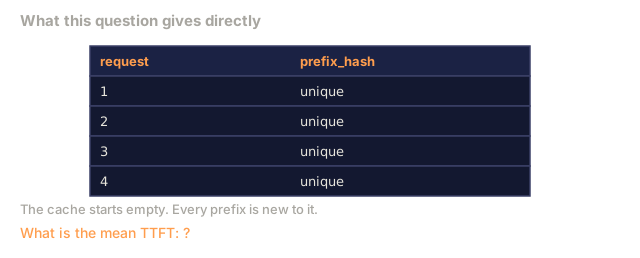
I'd run main.py before trusting any of the prose. It builds two 500-request workloads, one where every request carries the same 2000-token prompt and prefix, and one with prompt lengths drawn from a Gaussian around 500 tokens spread over 80 prefixes. The uniform run gets 499 cache hits and a P99 TTFT of 80 ms. The realistic run gets 421 hits and a P99 of 800 ms.
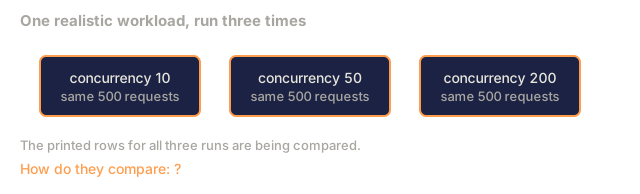
Read the numbers with the toy's limits in mind. TTFT is a constant: 80 ms on a hit, 800 ms on a miss. Prompt length never enters it, and TPOT_MS is defined but unused, so the script shows the cache effect and nothing about token-level latency. It also gives identical output at concurrency 10, 50, and 200, because the cache is shared across the whole run and the concurrency value only groups requests. That means the script says nothing about how concurrency changes the tail.
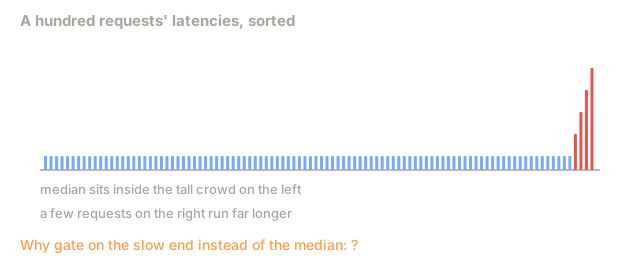
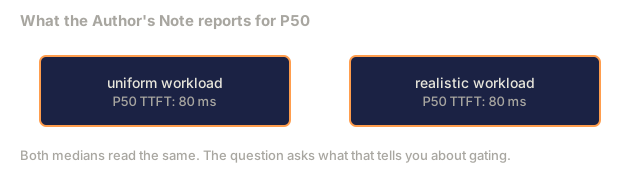
The gap is still the point. A P50 of 80 ms looks the same for both workloads. The P99 (80 ms vs 800 ms) is what separates them, so I'd gate on the tail and not the median. For a real run, I'd take prompt shapes from production traffic if I had them and fall back to LLMPerf's mean and stddev flags if I didn't.
Exercises
- Run
code/main.py. Compare uniform vs realistic distribution. Where is the gap? - Write the k6 script for a CI gate: TTFT P95 < 800 ms at 100 concurrent, runtime 5 minutes.
- Your soak test shows memory growing 50 MB/hour. Name three causes and the instrumentation to pick between them.
- Spike test from 10 RPS to 100 RPS. What's the expected recovery time if Karpenter + vLLM production-stack are in place (Phase 17 · 03 + 18)?
- GenAI-Perf reports TPOT=6ms; LLMPerf reports TPOT=11ms on the same server. Explain.
Key Terms
| Term | What people say | What it actually means |
|---|---|---|
| LLMPerf | "the LLM harness" | Anyscale benchmark tool, streaming-aware |
| GenAI-Perf | "NVIDIA tool" | NVIDIA reference harness |
| LLM-Locust | "Locust for LLMs" | Locust extension fixing GIL trap |
| guidellm | "synthetic benchmark" | Large-scale synthetic tool |
| k6 Operator | "K8s k6" | CRD-based distributed k6 |
| GIL trap | "Python client overhead" | Tokenization backlog inflates reported latency |
| Prompt-uniformity trap | "single-prompt lie" | Loop with same prompt hits cache, inflates throughput |
| Steady-state | "constant load" | Flat RPS for N minutes |
| Ramp | "linear up" | 0 to target over duration |
| Spike | "burst test" | Sudden multiplier then revert |
| Soak | "long test" | Hours for leak detection |
Code
- main.py (python, 90 lines)