Inference Metrics — TTFT, TPOT, ITL, Goodput, P99
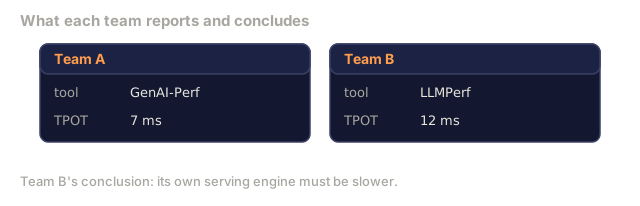
Four metrics tell you whether an inference deployment works. TTFT is queue plus network plus prefill. TPOT (also called ITL) is the memory-bound decode cost per token. End-to-end latency is TTFT plus TPOT times output length. Throughput is aggregate tokens per second across the fleet. The one that matters for the product is goodput: the fraction of requests that met every SLO constraint at once. High throughput at low goodput means you are producing tokens that reach users too late. Reference numbers for Llama-3.1-8B-Instruct on TRT-LLM in 2026: mean TTFT 162 ms, mean TPOT 7.33 ms, mean E2E 1,093 ms. Report P50, P90, and P99, not just the mean. And watch the measurement trap: GenAI-Perf excludes TTFT from the ITL calculation, LLMPerf includes it, so two tools can disagree on TPOT for the same run.
Learning Objectives
- Define TTFT, TPOT, ITL, E2E, throughput, and goodput precisely and name the component each one measures.
- Explain why mean is the wrong statistic for LLM serving and how to read P50/P90/P99.
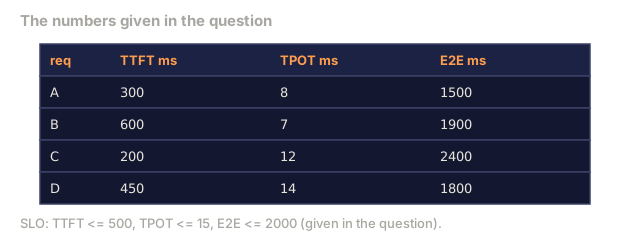
- Construct an SLO multi-constraint (e.g. TTFT<500 ms AND TPOT<15 ms AND E2E<2 s) and compute goodput against it.
- Name two benchmark tools that disagree on TPOT for the same run and explain why.
The Problem
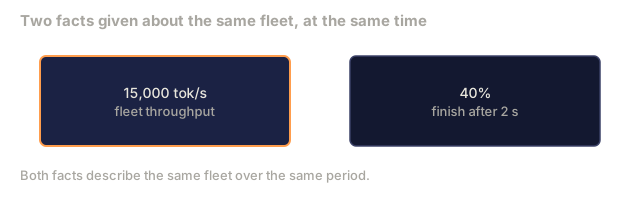
"Our throughput is 15,000 tokens per second." So what? If 40% of requests blew past 2 seconds end-to-end, users abandoned the session. Throughput alone does not tell you whether the product works.
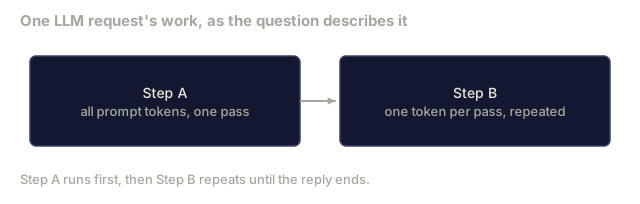
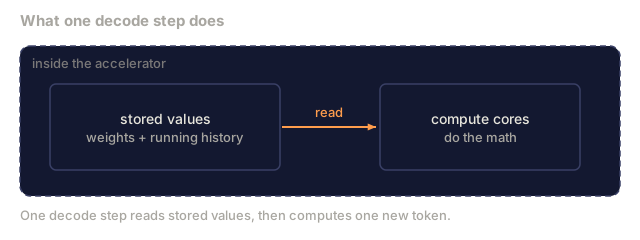
Inference has several axes of latency, and each one fails differently. Prefill is compute-bound and scales with prompt length. Decode is memory-bound and scales with batch size. Queuing delay is an operational problem, and network time is a physical-distance problem. Each needs its own metric, each needs percentiles, and you need one composite that answers "did the user get what they expected?" That composite is goodput.
The Concept
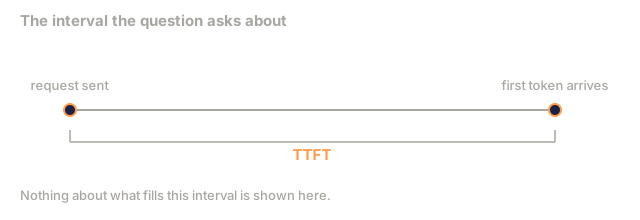
TTFT: time to first token
TTFT = queue_time + network_request + prefill_time
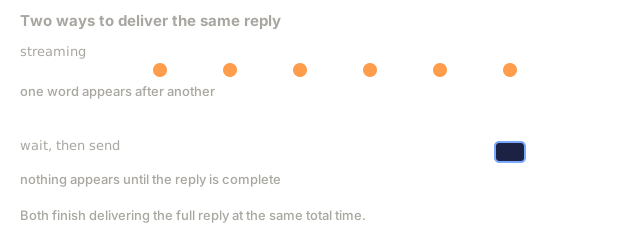
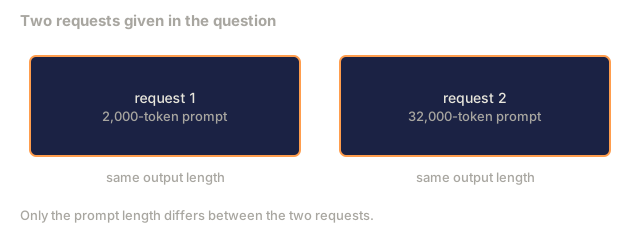
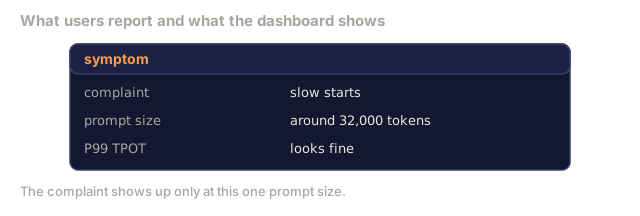
Prefill dominates when prompts are long. On Llama-3.3-70B FP8 on H100, a 32k prompt takes ~800 ms of pure prefill. Queue time is scheduler behavior under load. Network request is wire time including TLS. TTFT is the latency the user sees before anything streams back.
TPOT / ITL: inter-token latency
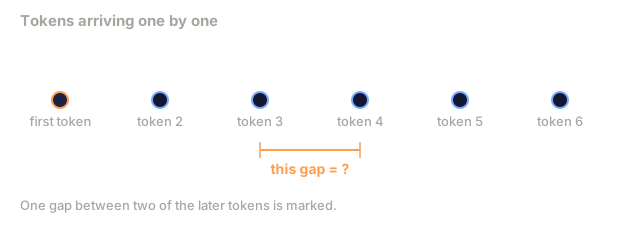
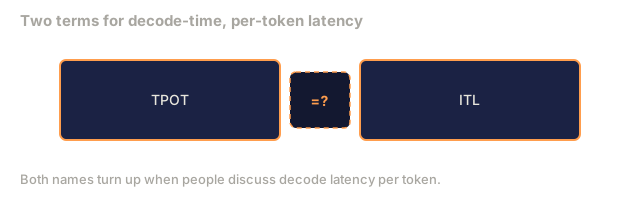
One quantity, many names: TPOT (time per output token), ITL (inter-token latency), decode latency per token. It is the time between consecutive streamed tokens after the first.
TPOT = (decode_forward_time + scheduler_overhead) / tokens_produced
On the same Llama-3.3-70B H100 stack with chunked prefill, mean TPOT is ~7 ms. Without chunked prefill, a long prefill on a neighboring sequence can push TPOT to 50 ms. Watch P99, not the mean.
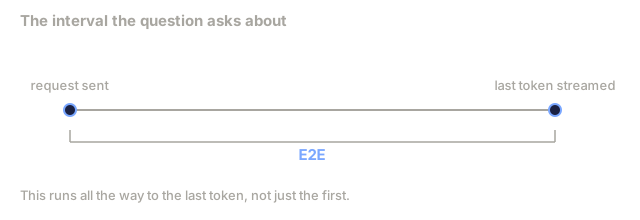
E2E latency
E2E = TTFT + TPOT * output_tokens + network_response
For long outputs (>500 tokens), TPOT dominates E2E. For short outputs with long prompts, TTFT dominates. Report E2E conditioned on output length.
Throughput
throughput = total_output_tokens / elapsed_time
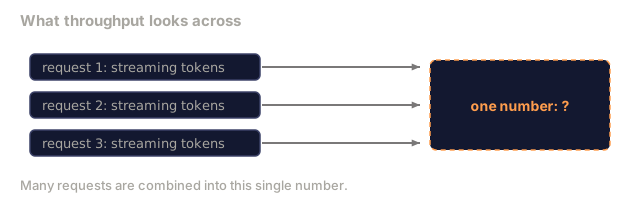
This is an aggregate number. It tells you how efficiently the fleet runs and nothing about the health of any single request.
Goodput: the metric you actually care about
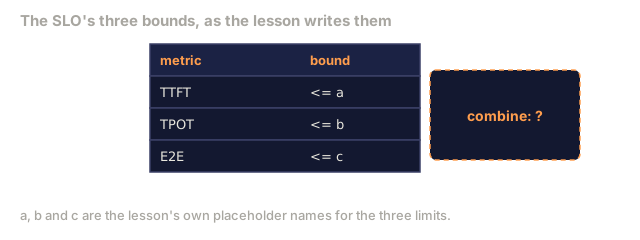
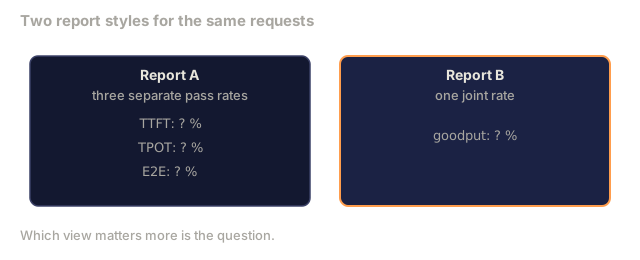
goodput = fraction of requests meeting (TTFT <= a) AND (TPOT <= b) AND (E2E <= c)
The SLO is a multi-constraint. A request counts as good only if every constraint held, and goodput is the share of requests that did. High throughput at 60% goodput is a failing deployment. Lower throughput at 99% goodput is the target.
In 2026, goodput is the metric used in MLPerf Inference v6.0 submissions and in internal SLA tracking at AI platform providers.
Why the mean misleads
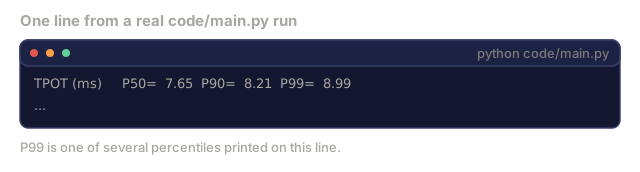
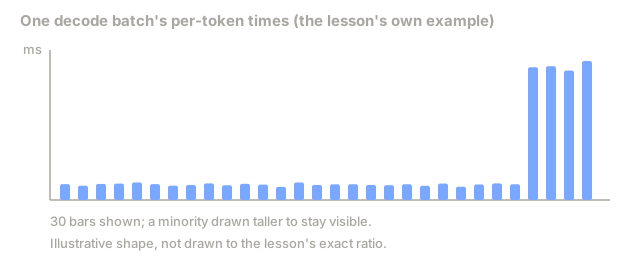
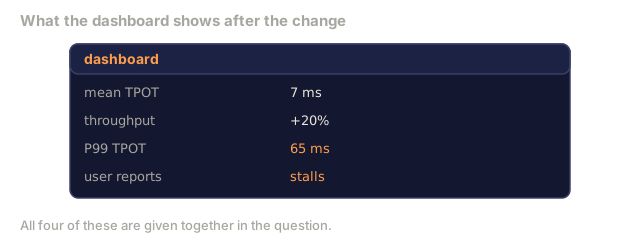
LLM latency distributions are right-skewed. Say a decode batch has one long-prefill neighbor: it can ship 500 tokens at ~7 ms TPOT and 20 tokens at ~60 ms. Mean TPOT comes out at 9 ms while P99 TPOT is 65 ms. Users hit that P99 regularly, and that is when they leave.
Report the triple (P50, P90, P99). For user experience, P99 is the one to optimize.
Reference numbers: Llama-3.1-8B-Instruct on TRT-LLM, 2026
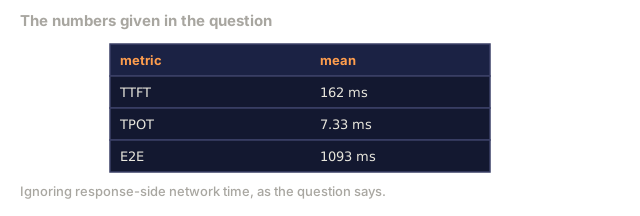
- mean TTFT: 162 ms
- mean TPOT: 7.33 ms
- mean E2E: 1,093 ms
- P99 TPOT: varies from 10 to 25 ms depending on chunked-prefill configuration.
These are the published NVIDIA reference points. They shift with model size (70B would show 3-5x), hardware (H100 vs B200 ~3x), and load.
The measurement trap
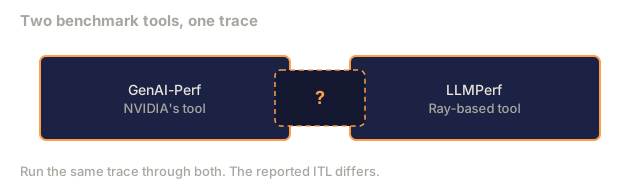
Two of the most-used 2026 benchmark tools disagree on TPOT for the same run:
- NVIDIA GenAI-Perf: excludes TTFT from the ITL calculation. ITL starts from token 2.
- LLMPerf: includes TTFT. ITL starts from token 1.
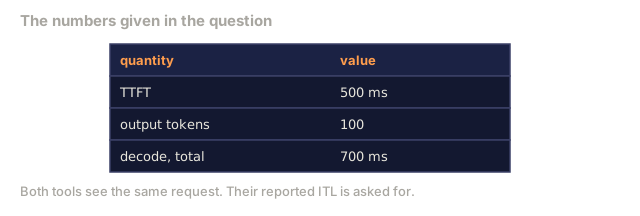
Take a request with TTFT 500 ms and 100 output tokens in 700 ms of total decode. GenAI-Perf reports ITL = 700/99 = 7.07 ms. LLMPerf reports ITL = 1200/100 = 12.00 ms. Same run, different number, depending on the tool.
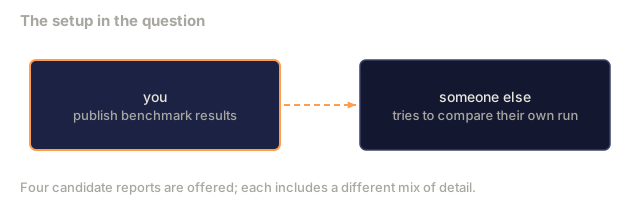
State which tool you used and publish its definition.
Constructing an SLO
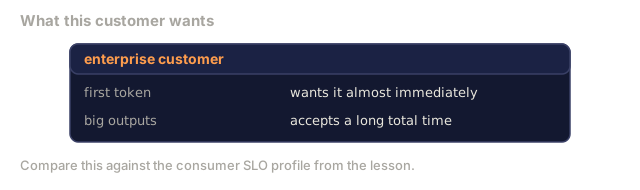
A reasonable consumer-facing SLO for a 70B chat model in 2026:
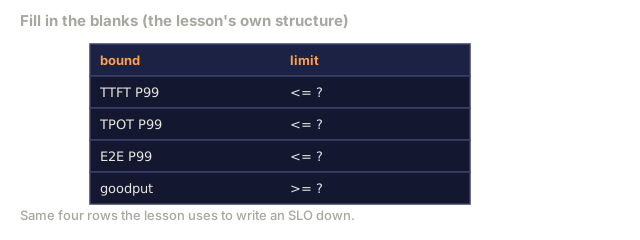
- TTFT P99 <= 800 ms.
- TPOT P99 <= 25 ms.
- E2E P99 <= 3 s for <300-token outputs.
- Goodput target >= 99%.
Enterprise SLOs tighten TTFT (200-400 ms) and loosen E2E. What matters is that you write the bounds down, measure all three, and track goodput as one composite.
How to measure
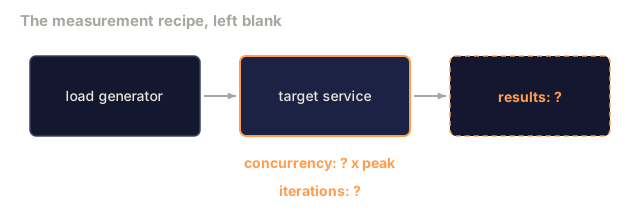
- Run real traffic or a realistic synthetic load (LLMPerf with
--mean-input-tokens 800 --stddev-input-tokens 300 --mean-output-tokens 150). - Target 2x peak concurrency for the benchmark run.
- Run 30-50 iterations and take percentiles of the combined sample.
- Publish the tool name, tool version, model, hardware, concurrency, and prompt distribution.
Use It
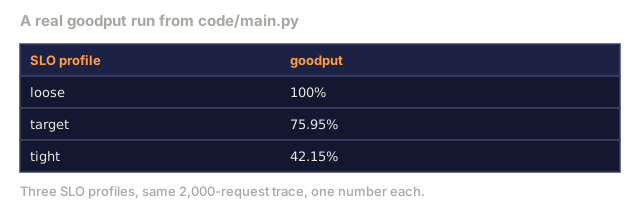
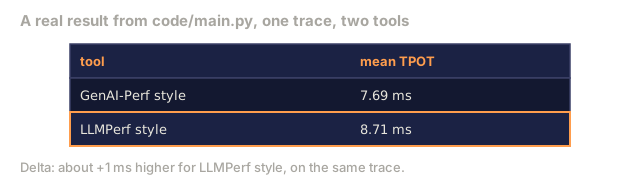
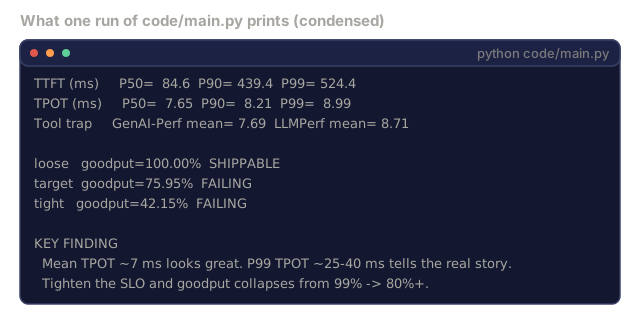
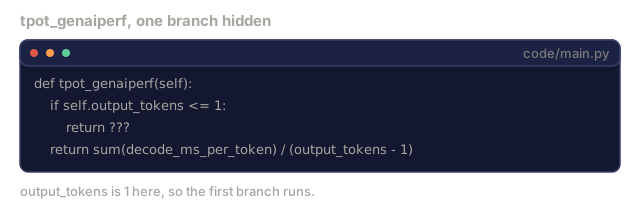
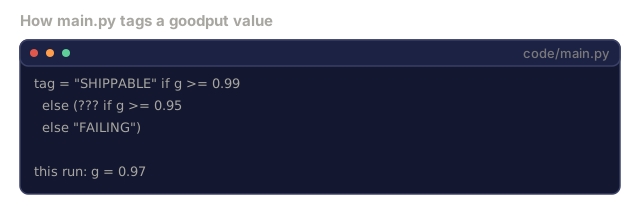
code/main.py is a toy goodput calculator in stdlib Python. It simulates 2,000 requests with right-skewed latency (exponential queue time, prefill proportional to prompt length, noisy per-token decode with occasional tail spikes), applies three SLO profiles, and prints goodput for each. It also computes TPOT both ways, GenAI-Perf style and LLMPerf style, on the same trace.
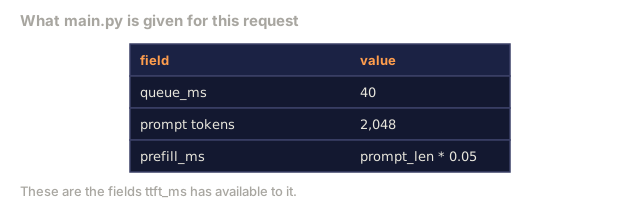
Two simplifications to keep in mind. TTFT in the toy is queue plus prefill, with no network term. And the "KEY FINDING" block at the bottom is fixed text, not computed from the run, so trust the numbers printed above it.
Ship It
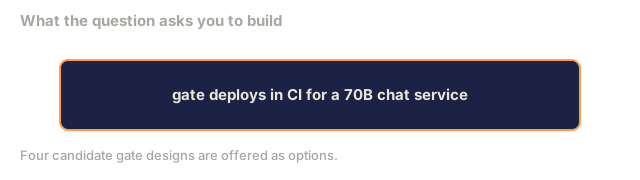
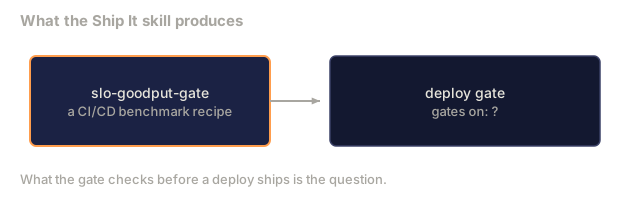
This lesson produces outputs/skill-slo-goodput-gate.md. Given a workload and SLO, it produces a CI/CD-ready benchmark recipe that gates deploys on goodput rather than throughput.
I'd run main.py first and read the three goodput lines before the prose. With the defaults (2,000 requests, seed 7, 2% tail spikes) the loose SLO passes every request, the target SLO (TTFT<500, TPOT<15, E2E<2000) lands around 76%, and the tight one around 42%. That is the multi-constraint idea in one screen.
The part that surprised me is which constraint does the damage. Per-request TPOT in the toy is an average over 50 to 300 decode tokens, so the tail spikes get smoothed out and P99 TPOT stays near 9 ms. The goodput loss comes from E2E and TTFT. A spike that hurts the user can vanish from a per-request TPOT number, which is a good argument for looking at percentiles of E2E alongside it.
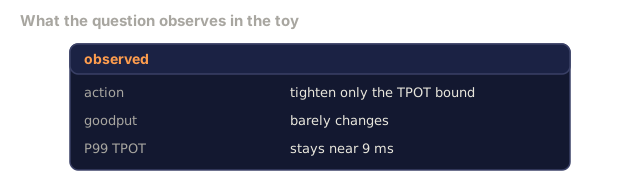
I'd also read the tool-trap line as a reminder to cite the tool. The two TPOT definitions differ by about 1 ms on the mean here, because the LLMPerf version folds queue and prefill into the numerator. If you try the first exercise, expect tightening TPOT alone to move goodput very little in this toy. Pooling per-token latencies instead of averaging per request would be the change to try next.
Exercises
- Run
code/main.py. Generate a distribution with 1% tail spike. How does goodput change when you tighten P99 TPOT from 30 ms to 15 ms? - A vendor quotes "15,000 tok/s on Llama 3.3 70B H100". Name three questions to ask before trusting it.
- Why does chunked prefill protect P99 TPOT but not mean TPOT?
- Construct a consumer SLO for a voice assistant (first token is heard, not read). Which metric is most user-visible?
- Read the LLMPerf README and the GenAI-Perf docs. Identify three other metrics where the tools disagree.
Key Terms
| Term | What people say | What it actually means |
|---|---|---|
| TTFT | "time to first token" | Queue + network + prefill; dominated by prefill at long prompts |
| TPOT | "time per output token" | Memory-bound decode cost per token after first |
| ITL | "inter-token latency" | Same as TPOT in most tools (not all, see GenAI-Perf) |
| E2E | "end to end" | TTFT + TPOT * output_len; response-side network on top |
| Throughput | "tok/s" | Fleet efficiency; useless without latency percentiles |
| Goodput | "SLO-met rate" | Fraction of requests meeting every SLO constraint simultaneously |
| P99 | "tail" | 1-in-100 worst-case latency; the user experience metric |
| SLO multi-constraint | "the joint" | AND of all three latency bounds; a request fails if any one is violated |
| GenAI-Perf vs LLMPerf | "the tool trap" | Tools disagree on whether ITL includes TTFT |
Further Reading
- NVIDIA NIM: LLM Benchmarking Metrics. Canonical definitions of TTFT, ITL, and TPOT.
- Anyscale: LLM Serving Benchmarking Metrics. Alternative definitions and a measurement recipe.
- BentoML: LLM Inference Metrics. Applied measurement on real deployments.
- LLMPerf. Ray-based open-source benchmark.
- GenAI-Perf. NVIDIA's benchmark tool.
- MLPerf Inference. The industry-accepted goodput-based benchmark.
Code
- main.py (python, 127 lines)