Decision Trees and Random Forests
A decision tree is a flowchart that learned which questions to ask. A forest of them is one of the strongest tools in ML.
Learning Objectives
- Implement Gini impurity, entropy, and information gain calculations to find optimal decision tree splits
- Build a decision tree classifier from scratch with pre-pruning controls (max depth, min samples)
- Construct a random forest using bootstrap sampling and feature randomization, and explain why it reduces variance
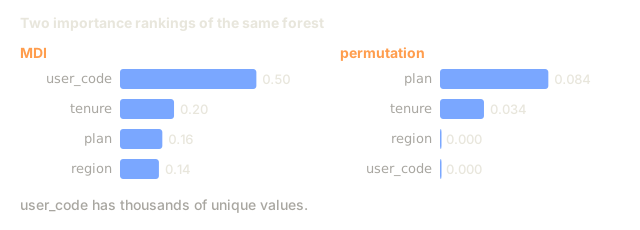
- Compare MDI feature importance with permutation importance and identify when MDI is biased
The Problem
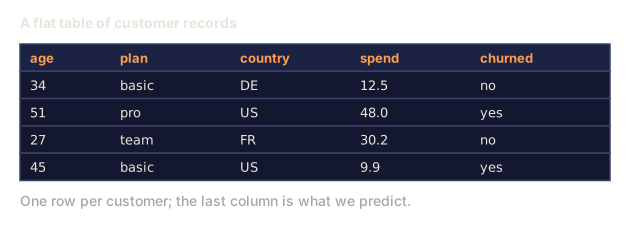
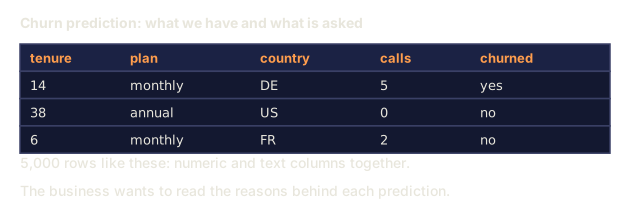
You have tabular data: rows are samples, columns are features, and one column is the target you're trying to predict. It's tempting to reach for a neural network. Don't. For tabular data, tree-based models (decision trees, random forests, gradient boosted trees) consistently beat deep learning, and Kaggle's structured-data leaderboards prove it: XGBoost and LightGBM win, not transformers.
Why? Trees handle mixed feature types (numeric and categorical) with zero preprocessing. They pick up nonlinear relationships without any feature engineering. They're interpretable: read the tree and you know exactly why it made a given prediction. And a random forest, which averages many trees together, is highly resistant to overfitting on moderate-sized datasets.
This lesson builds a decision tree from scratch with recursive splitting, then stacks a random forest on top of it. You'll implement the math behind split criteria (Gini impurity, entropy, information gain) and see exactly why an ensemble of weak learners adds up to one strong learner.
The Concept
What a decision tree does
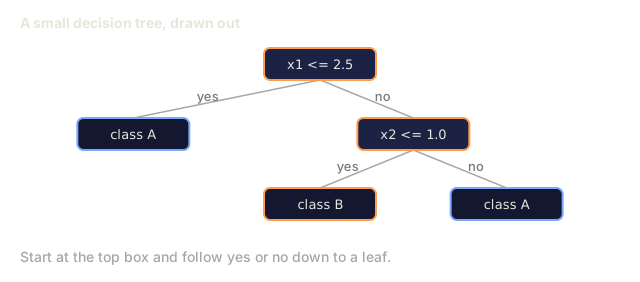
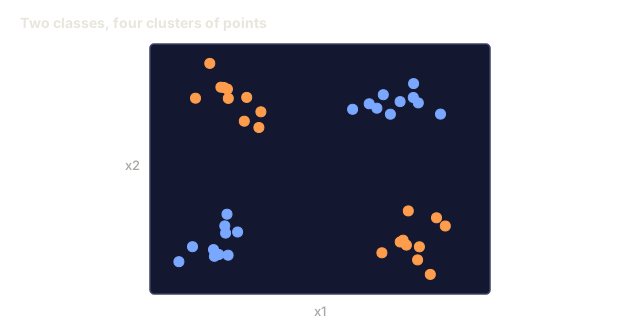
A decision tree partitions the feature space into rectangular regions by asking a sequence of yes/no questions.

Each internal node tests one feature against a threshold; each leaf makes a prediction. Classify a new point by starting at the root and following branches down until you hit a leaf.
The tree gets built top-down: at each node, pick the feature and threshold that best separate the data. What counts as "best" is defined by a split criterion.
Split criteria: measuring impurity
At each node you're holding a set of samples, and you want to split them so the resulting child nodes are as "pure" as possible: each child dominated by a single class.
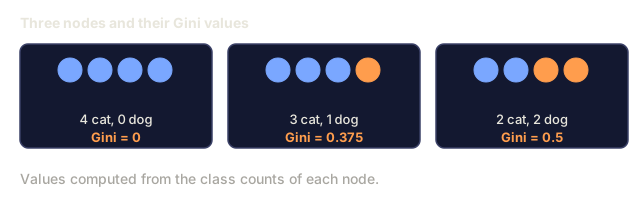
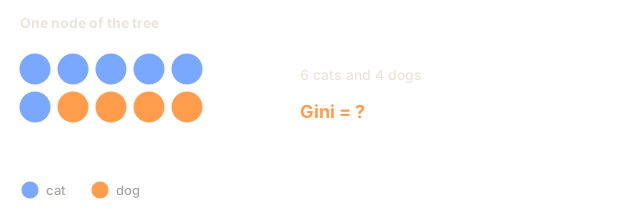
Gini impurity measures the probability that a randomly picked sample gets misclassified if you label it according to the node's class distribution.
Gini(S) = 1 - sum(p_k^2)

where p_k is the proportion of class k in set S.
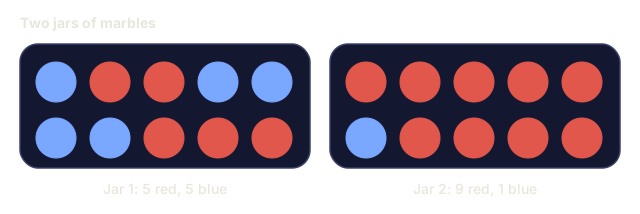
For a pure node (all one class), Gini is 0. A 50/50 binary split lands at Gini 0.5. Lower is better.
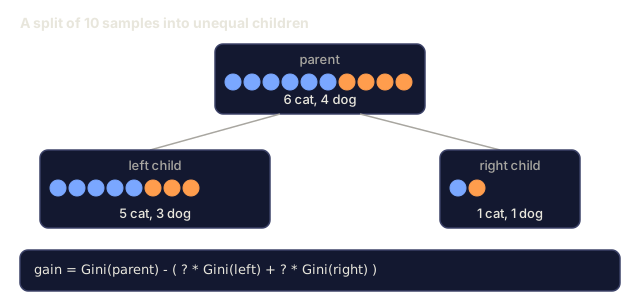
Example: 6 cats, 4 dogs

Gini = 1 - (0.6^2 + 0.4^2) = 1 - (0.36 + 0.16) = 0.48
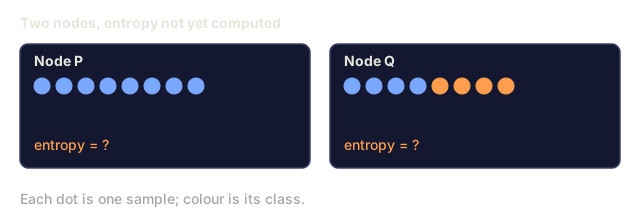
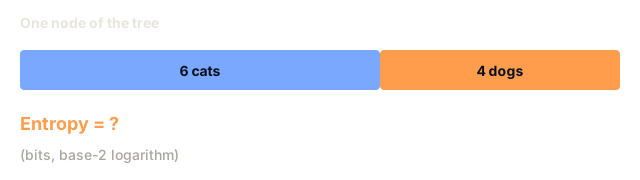
Entropy measures a node's information content, its disorder. Phase 1 Lesson 09 covers it in depth.
Entropy(S) = -sum(p_k * log2(p_k))
For a pure node, entropy is 0. A 50/50 binary split hits entropy 1.0. Lower is better.
Example: 6 cats, 4 dogs

Entropy = -(0.6 * log2(0.6) + 0.4 * log2(0.4))
        = -(0.6 * -0.737 + 0.4 * -1.322)
        = 0.442 + 0.529
        = 0.971 bits
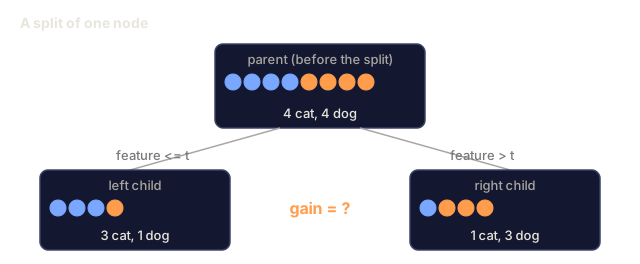
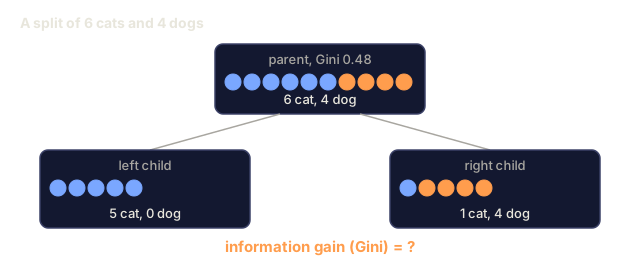
Information gain is the drop in impurity, Gini or entropy, that a split buys you.
IG(S, feature, threshold) = Impurity(S) - weighted_avg(Impurity(S_left), Impurity(S_right))

where the weights are the proportions of samples in each child.
The greedy algorithm at each node is simple: try every feature and every possible threshold, then keep whichever (feature, threshold) pair maximizes information gain.
How splitting works
For a dataset with n features and m samples at the current node:
- For each feature j (j = 1 to n):
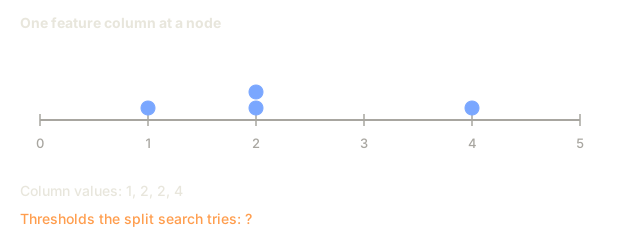
- Sort the samples by feature j
- Try every midpoint between consecutive distinct values as a threshold
- Compute the information gain for each threshold
- Select the feature and threshold with the highest information gain
- Split the data into left (feature <= threshold) and right (feature > threshold)
- Recurse on each child
This greedy approach doesn't guarantee the globally optimal tree, and finding that optimal tree is NP-hard anyway. Greedy splitting still works well in practice.
Stopping conditions
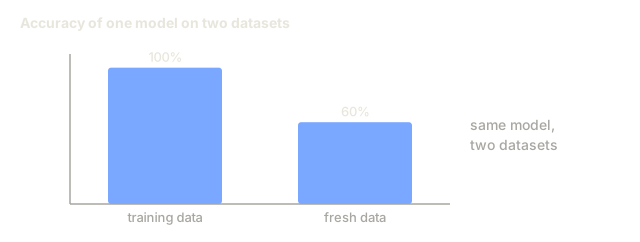
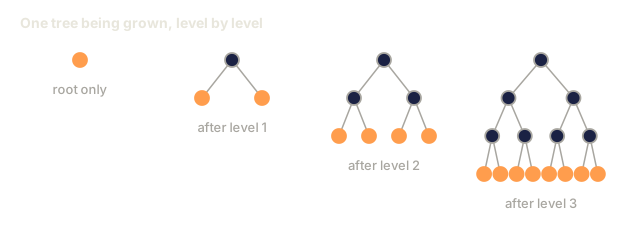
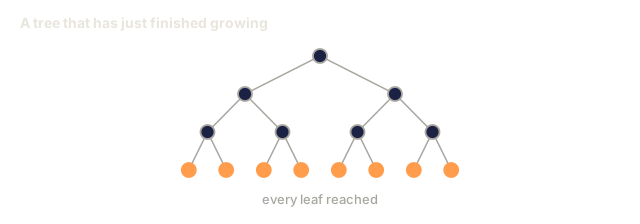
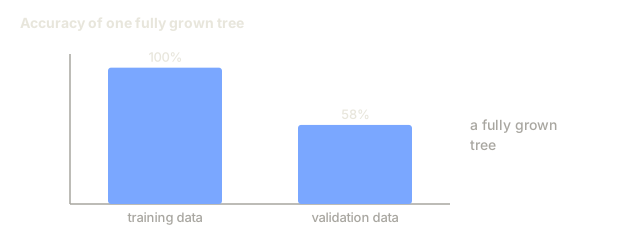
Left alone, the tree keeps growing until every leaf is pure, one sample per leaf. That memorizes the training data perfectly, and generalizes terribly.
Pre-pruning stops the tree before it fully grows:
- Maximum depth: stop splitting when the tree reaches a set depth
- Minimum samples per leaf: stop if a node has fewer than k samples
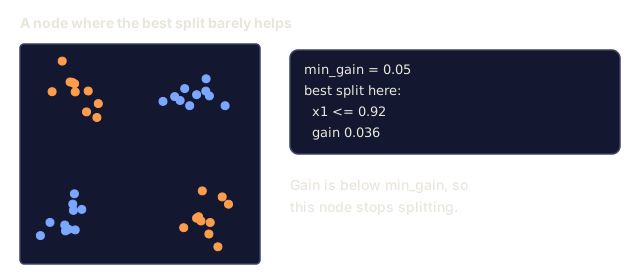
- Minimum information gain: stop if the best split improves impurity by less than a threshold
- Maximum leaf nodes: limit the total number of leaves
Post-pruning grows the full tree, then trims it back:
- Cost-complexity pruning (used by scikit-learn): adds a penalty proportional to the number of leaves. Increase the penalty to get smaller trees
- Reduced error pruning: remove a subtree if the validation error does not increase
Pre-pruning is simpler and faster to run. Post-pruning tends to produce better trees, since it never prematurely kills a split that would have paid off a level or two down.
Decision trees for regression
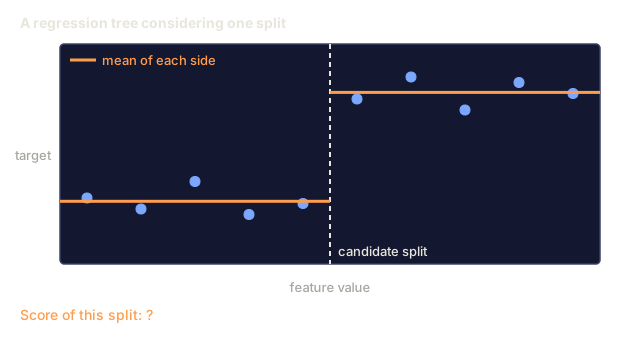
For regression, each leaf predicts the mean of its target values, and the split criterion changes to match:
Variance reduction replaces information gain:
VR(S, feature, threshold) = Var(S) - weighted_avg(Var(S_left), Var(S_right))
Pick whichever split reduces variance the most. The tree still partitions the input space into regions; it just predicts a constant, the region's mean, in each one.
Random forests: the power of ensembles
A single decision tree runs high variance: a small change in the training data can produce a completely different tree. Random forests fix this by averaging many trees together.

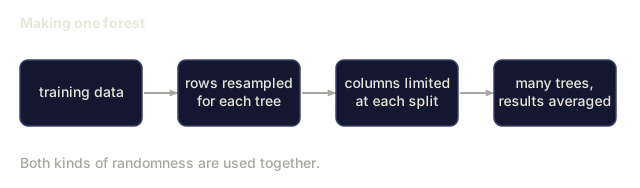
Two sources of randomness keep those trees from all looking alike:
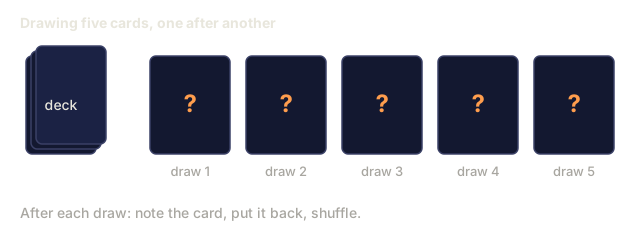
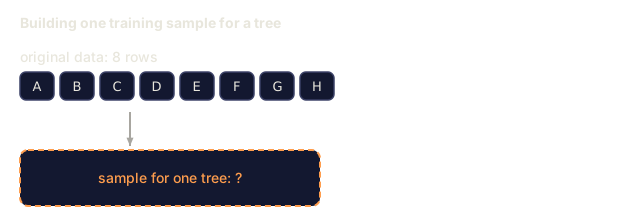
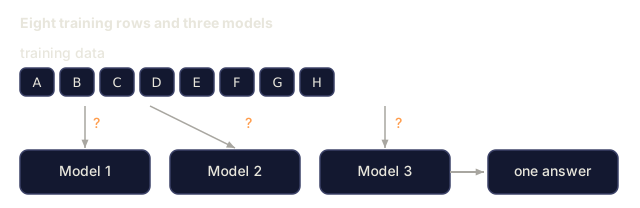
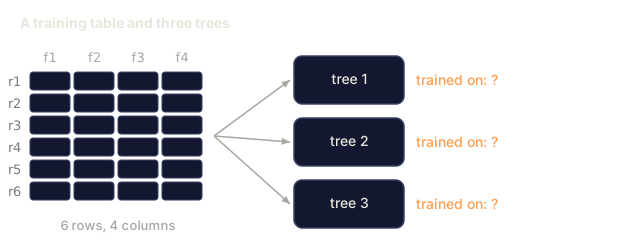
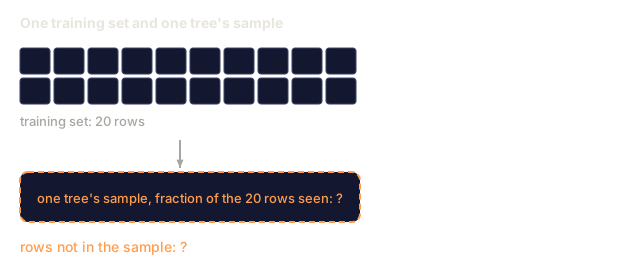
Bagging (bootstrap aggregating): each tree trains on a bootstrap sample, a random sample with replacement drawn from the training data. Roughly 63% of the original samples show up in any given bootstrap; the rest are out-of-bag samples you can use for validation.
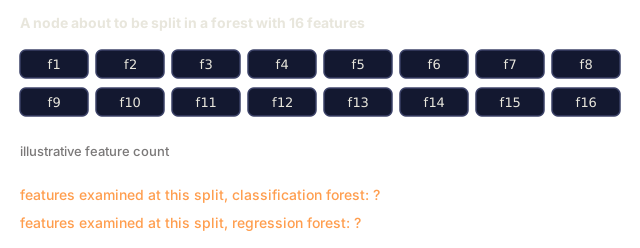
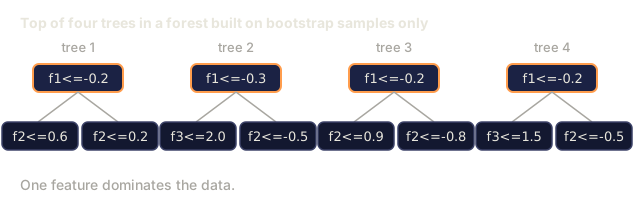
Feature randomization: at each split, the tree only gets to consider a random subset of features, sqrt(n_features) by default for classification, n_features/3 for regression. That stops every tree from splitting on whatever feature happens to dominate.
The key insight: average enough decorrelated trees and variance drops without bias going up. Any single tree in the forest might be mediocre. The forest isn't.
Feature importance
Random forests hand you feature importance scores for free. The most common method:
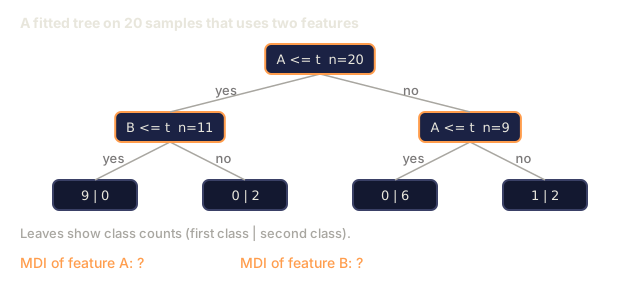
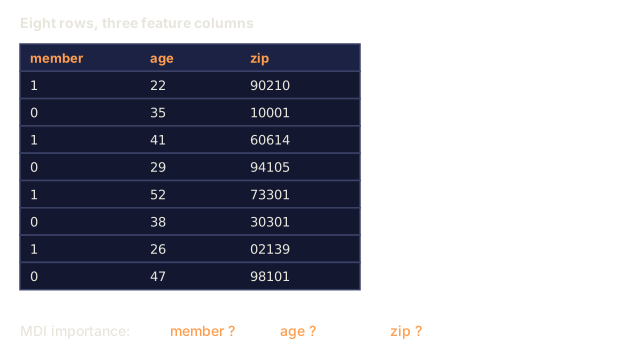
Mean Decrease in Impurity (MDI): for each feature, add up the total impurity reduction across every tree and every node where that feature gets used. A feature that drives bigger impurity drops, especially at early splits, ranks as more important.
importance(feature_j) = sum over all nodes where feature_j is used:
    (n_samples_at_node / n_total_samples) * impurity_decrease
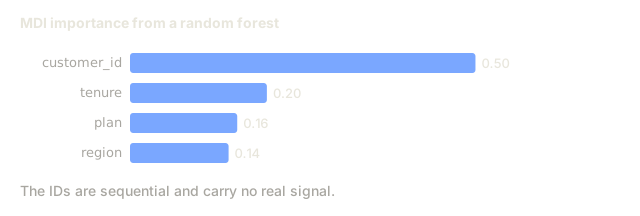
MDI is fast, computed right there during training, but it's biased toward high-cardinality features and features with lots of possible split points.
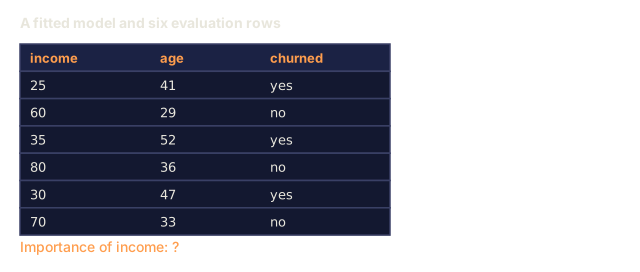
Permutation importance is the fix: shuffle one feature's values and measure how far the model's accuracy falls. Slower, but far more reliable.
When trees beat neural networks
Trees and forests dominate neural networks on tabular data, for several reasons:
| Factor | Trees | Neural networks |
|---|---|---|
| Mixed types (numeric + categorical) | Native support | Need encoding |
| Small datasets (< 10k rows) | Work well | Overfit |
| Feature interactions | Found by splitting | Need architecture design |
| Interpretability | Full transparency | Black box |
| Training time | Minutes | Hours |
| Hyperparameter sensitivity | Low | High |
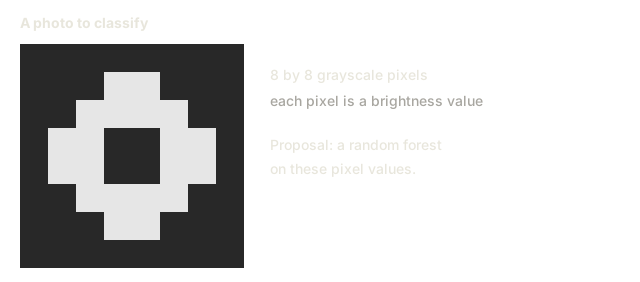
Neural networks take over once the data has spatial or sequential structure: images, text, audio. For flat feature tables, trees are the default.
Build It
Step 1: Gini impurity and entropy
Build both split criteria from scratch, then check that they agree on which splits look good.
import math

def gini_impurity(labels):
    n = len(labels)
    if n == 0:
        return 0.0
    counts = {}
    for label in labels:
        counts[label] = counts.get(label, 0) + 1
    return 1.0 - sum((c / n) ** 2 for c in counts.values())

def entropy(labels):
    n = len(labels)
    if n == 0:
        return 0.0
    counts = {}
    for label in labels:
        counts[label] = counts.get(label, 0) + 1
    return -sum(
        (c / n) * math.log2(c / n) for c in counts.values() if c > 0
    )
Step 2: Find the best split
Sweep every feature and every threshold, and return whichever pair maximizes information gain.
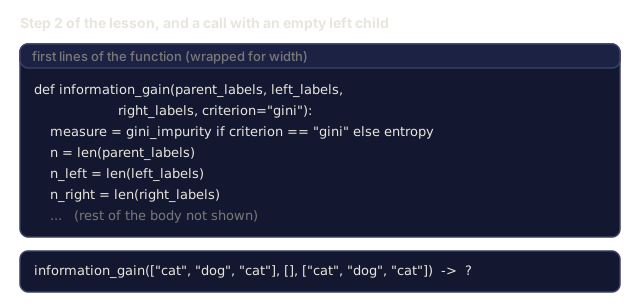
def information_gain(parent_labels, left_labels, right_labels, criterion="gini"):
    measure = gini_impurity if criterion == "gini" else entropy
    n = len(parent_labels)
    n_left = len(left_labels)
    n_right = len(right_labels)
    if n_left == 0 or n_right == 0:
        return 0.0
    parent_impurity = measure(parent_labels)
    child_impurity = (
        (n_left / n) * measure(left_labels) +
        (n_right / n) * measure(right_labels)
    )
    return parent_impurity - child_impurity
Step 3: Build the DecisionTree class
Recursive splitting, prediction, and feature-importance tracking, all in one class.
class DecisionTree:
    def __init__(self, max_depth=None, min_samples_split=2,
                 min_samples_leaf=1, criterion="gini",
                 max_features=None):
        self.max_depth = max_depth
        self.min_samples_split = min_samples_split
        self.min_samples_leaf = min_samples_leaf
        self.criterion = criterion
        self.max_features = max_features
        self.tree = None
        self.feature_importances_ = None

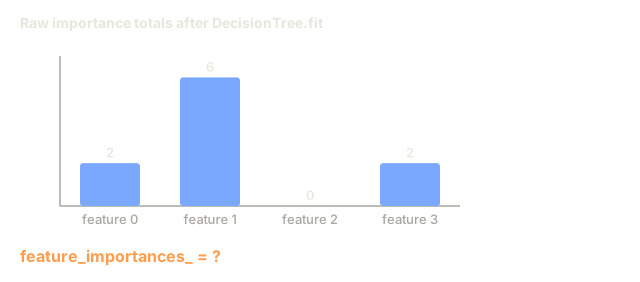
    def fit(self, X, y):
        self.n_features = len(X[0])
        self.feature_importances_ = [0.0] * self.n_features
        self.n_samples = len(X)
        self.tree = self._build(X, y, depth=0)
        total = sum(self.feature_importances_)
        if total > 0:
            self.feature_importances_ = [
                fi / total for fi in self.feature_importances_
            ]

    def predict(self, X):
        return [self._predict_one(x, self.tree) for x in X]
Step 4: Build the RandomForest class
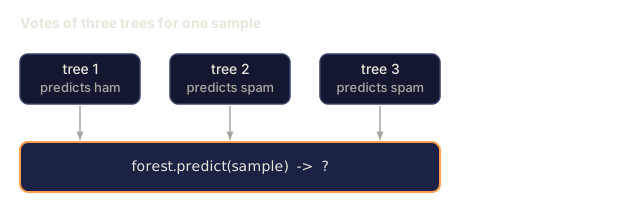
Bootstrap sampling, feature randomization, and majority-vote prediction.
class RandomForest:
    def __init__(self, n_trees=100, max_depth=None,
                 min_samples_split=2, max_features="sqrt",
                 criterion="gini"):
        self.n_trees = n_trees
        self.max_depth = max_depth
        self.min_samples_split = min_samples_split
        self.max_features = max_features
        self.criterion = criterion
        self.trees = []

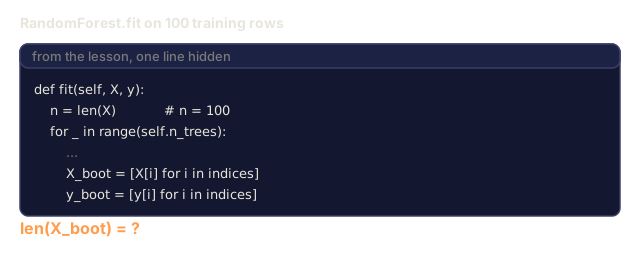
    def fit(self, X, y):
        n = len(X)
        for _ in range(self.n_trees):
            indices = [random.randint(0, n - 1) for _ in range(n)]
            X_boot = [X[i] for i in indices]
            y_boot = [y[i] for i in indices]
            tree = DecisionTree(
                max_depth=self.max_depth,
                min_samples_split=self.min_samples_split,
                max_features=self.max_features,
                criterion=self.criterion,
            )
            tree.fit(X_boot, y_boot)
            self.trees.append(tree)

    def predict(self, X):
        all_preds = [tree.predict(X) for tree in self.trees]
        predictions = []
        for i in range(len(X)):
            votes = {}
            for preds in all_preds:
                v = preds[i]
                votes[v] = votes.get(v, 0) + 1
            predictions.append(max(votes, key=votes.get))
        return predictions
See code/trees.py for the full implementation, with every helper method included.
Use It
With scikit-learn, training a random forest takes three lines:
from sklearn.ensemble import RandomForestClassifier
from sklearn.datasets import load_iris
from sklearn.model_selection import train_test_split

X, y = load_iris(return_X_y=True)
X_train, X_test, y_train, y_test = train_test_split(X, y, random_state=42)

rf = RandomForestClassifier(n_estimators=100, random_state=42)
rf.fit(X_train, y_train)
print(f"Accuracy: {rf.score(X_test, y_test):.4f}")
print(f"Feature importances: {rf.feature_importances_}")
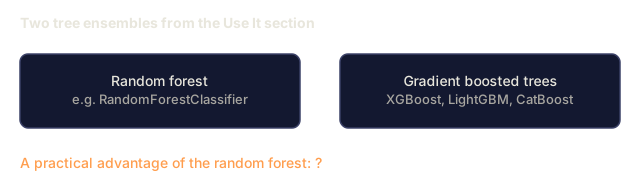
In practice, gradient boosted trees (XGBoost, LightGBM, CatBoost) usually beat random forests, since each new tree gets built to correct the previous ones' errors. Random forests still hold their own: they're harder to misconfigure, and they need almost no hyperparameter tuning.
Ship It
This lesson produces outputs/prompt-tree-interpreter.md, a prompt that interprets decision tree splits for business stakeholders. Feed it a trained tree's structure (depth, features, split thresholds, accuracy), and it translates the model into plain-language rules, ranks feature importance, flags overfitting or leakage, and recommends next steps. Use it any time you need to explain a tree-based model to someone who doesn't read code.
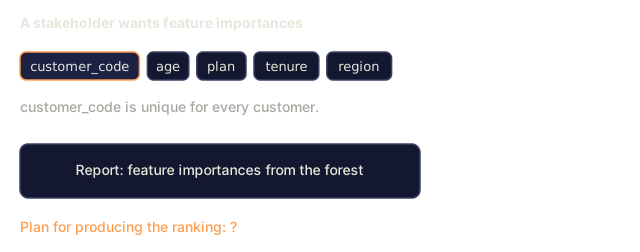
The MDI bias isn't a footnote, it's the thing that actually burns people in production. I've watched an ID-like column, something with thousands of unique values and zero real signal, come out on top of an MDI importance ranking simply because it had endless places to split. If you take one habit from this lesson into a real project, make it this: never hand a stakeholder an MDI ranking without running permutation importance next to it. When the two agree, you're fine. When they don't, MDI is almost always the one that's wrong, and a high-cardinality column is almost always the culprit.
The other habit worth building early: reach for a random forest before you reach for a gradient boosted tree, even knowing GBTs usually win on raw accuracy. A forest with default settings rarely blows up on you. A GBT with default settings can, depending on the dataset and how much tuning patience you have. Get the boring model working first, then decide whether the accuracy gap is worth the extra tuning.
Exercises
-
Train a single decision tree on a 2D dataset with 3 classes. Manually trace the splits and draw the rectangular decision boundaries. Compare the boundaries at max_depth=2 vs max_depth=10.
-
Implement variance reduction splitting for regression trees. Generate y = sin(x) + noise for 200 points and fit your regression tree. Plot the tree's piecewise-constant predictions against the true curve.
-
Build a random forest with 1, 5, 10, 50, and 200 trees. Plot training accuracy and test accuracy vs number of trees. Observe that test accuracy plateaus but does not decrease (forests resist overfitting).
-
Compare Gini impurity vs entropy as split criteria on 5 different datasets. Measure accuracy and tree depth. In most cases, they produce nearly identical results. Explain why.
-
Implement permutation importance. Compare it with MDI importance on a dataset where one feature is random noise but has high cardinality. MDI will rank the noise feature highly. Permutation importance will not.
Key Terms
| Term | What people say | What it actually means |
|---|---|---|
| Decision tree | "A flowchart for predictions" | A model that partitions feature space into rectangular regions by learning a sequence of if/else splits |
| Gini impurity | "How mixed the node is" | Probability of misclassifying a random sample at a node. 0 = pure, 0.5 = maximum impurity for binary |
| Entropy | "The disorder in a node" | Information content at a node. 0 = pure, 1.0 = maximum uncertainty for binary. From information theory |
| Information gain | "How good a split is" | Reduction in impurity after a split. The greedy criterion for choosing splits |
| Pre-pruning | "Stop the tree early" | Stopping tree growth early by setting max depth, min samples, or min gain thresholds |
| Post-pruning | "Trim the tree after" | Growing the full tree, then removing subtrees that do not improve validation performance |
| Bagging | "Train on random subsets" | Bootstrap aggregating. Train each model on a different random sample with replacement |
| Random forest | "A bunch of trees" | Ensemble of decision trees, each trained on a bootstrap sample with random feature subsets at each split |
| Feature importance (MDI) | "Which features matter" | Total impurity decrease contributed by each feature, summed across all trees and nodes |
| Permutation importance | "Shuffle and check" | Accuracy drop when a feature's values are randomly shuffled. More reliable than MDI for noisy features |
| Variance reduction | "The regression version of info gain" | The regression tree analogue of information gain. Picks the split that reduces target variance the most |
| Bootstrap sample | "Random sample with repeats" | A random sample drawn with replacement from the original dataset. Same size, but with duplicates |
Further Reading
- Breiman: Random Forests (2001) - the original random forest paper
- Grinsztajn et al.: Why do tree-based models still outperform deep learning on tabular data? (2022) - rigorous comparison of trees vs neural networks on tabular tasks
- scikit-learn Decision Trees documentation - practical guide with visualization tools
- XGBoost: A Scalable Tree Boosting System (Chen & Guestrin, 2016) - the gradient boosting paper that dominates Kaggle
Code
- trees.py (python, 653 lines)