TAI BUI
Back to curriculum
LearnPython

Audio Fundamentals — Waveforms, Sampling, Fourier Transform

Waveforms are the raw signal. Spectrograms are the representation. Mel features are the ML-friendly form. Every ASR and TTS pipeline in 2026 climbs that same ladder, and the first rung is sampling and the Fourier transform. Get the first rung wrong and the rest of the stack is guesswork.

TIME: ~45 minutesPREREQUISITES: Phase 1 · 06 (Vectors & Matrices), Phase 1 · 14 (Probability Distributions)

Learning Objectives

  • Name the three questions that cause almost every silent bug in a speech pipeline: sample-rate mismatch, aliasing, and confusing raw samples with a frequency representation.
  • Explain the Nyquist-Shannon sampling theorem and pick the correct sample rate for ASR, TTS, and telephony workloads.
  • Compute a Discrete Fourier Transform by hand, map its bins back to frequencies in Hz, and explain why production code calls the FFT instead.
  • Reproduce aliasing by sampling a signal below its Nyquist frequency and predict where the resulting frequency peak lands.

The Problem

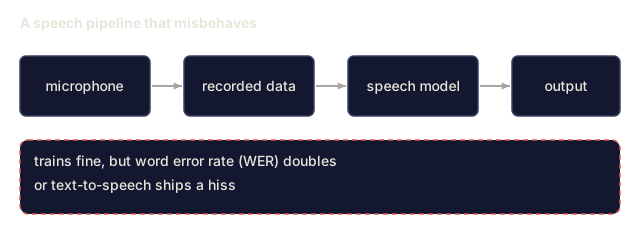
A microphone produces a pressure-vs-time signal. Your neural net consumes tensors. What sits between them is a stack of conventions, and violating any one of them produces a silent bug: the model trains fine but the WER (word error rate, the standard ASR accuracy metric) doubles, TTS ships a hiss, or a voice-cloning system memorizes the microphone instead of the speaker.

Every bug in speech systems traces back to one of three questions:

  1. What sample rate was the data recorded at, and what does the model expect?
  2. Is the signal aliased?
  3. Are you operating on raw samples or a frequency representation?

Get these three right and the rest of Phase 6 is tractable. Get any one wrong and even Whisper-Large-v4 produces garbage.
Warm-up0/3
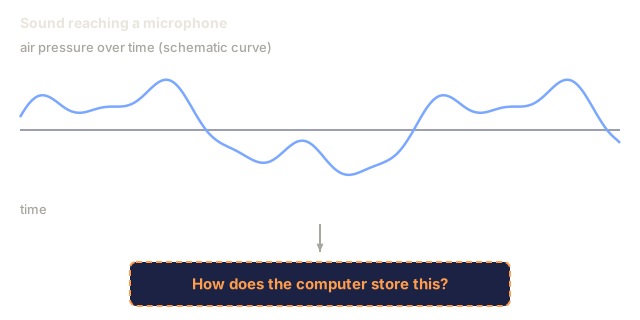
1. A microphone captures sound as a continuous, ever-changing pressure wave. Which of these is closest to how a computer stores that wave digitally?Warm-up
A smooth, continuous pressure curve over time, with an arrow down to a dashed box that asks how the computer stores it.
Schematic curve, not a recording.
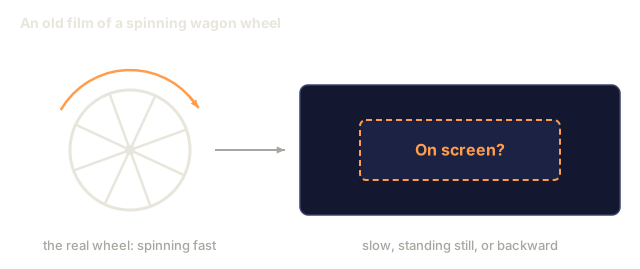
2. In old films, a fast-spinning wagon wheel sometimes looks like it is spinning slowly, standing still, or even turning backward. What causes that illusion?Warm-up
A wagon wheel with eight spokes and a clockwise arrow for fast spinning, an arrow to a film screen holding a dashed box that asks what appears on screen.
Schematic.
3. Which property of a sound wave mostly determines whether a note sounds high or low in pitch?Warm-up
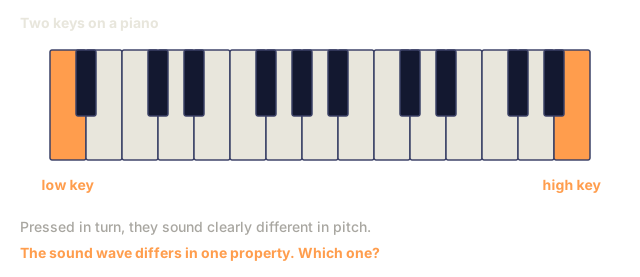
A piano keyboard of fifteen white keys with the leftmost key labelled low key and the rightmost labelled high key.
Schematic keyboard, two octaves.
Check: The Problem0/1
1. Every speech-system bug is said to trace back to one of three questions. Which of these is NOT one of them?Explain
A pipeline of four boxes, microphone, recorded data, speech model and output, with a dashed red note that training is fine but WER doubles or text-to-speech ships a hiss.
Schematic of the lesson's problem statement.

The Concept

Waveform, sampling, DFT, and frequency bins visualized

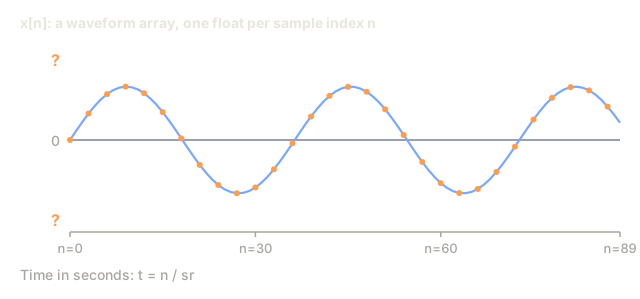
Waveform. A one-dimensional array of floats in [-1.0, 1.0], indexed by sample number. Divide the index by the sample rate to convert to seconds: t = n / sr. A 10-second clip at 16 kHz is an array of 160,000 floats.

Sampling rate (sr). How many samples per second. Common rates in 2026:

RateUse
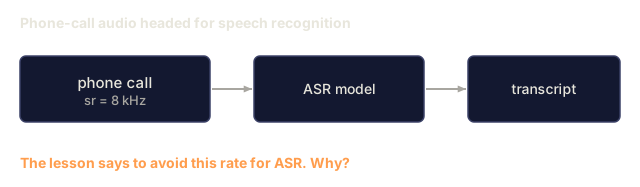
8 kHzTelephony, legacy VOIP. Nyquist at 4 kHz kills consonants. Avoid for ASR.
16 kHzASR standard. Whisper, Parakeet, SeamlessM4T v2 all consume 16 kHz.
22.05 kHzTTS vocoder training for older models.
24 kHzModern TTS (Kokoro, F5-TTS, xTTS v2).
44.1 kHzCD audio, music.
48 kHzFilm, pro audio, high-fidelity TTS (VALL-E 2, NaturalSpeech 3).

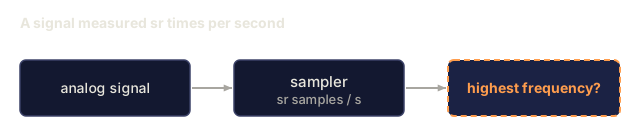
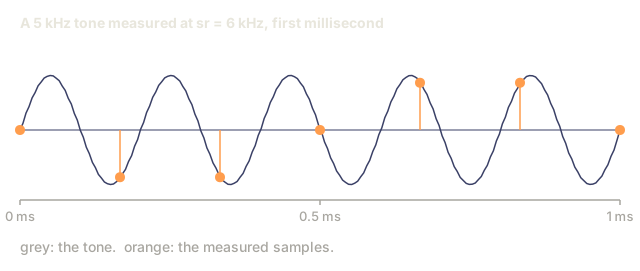
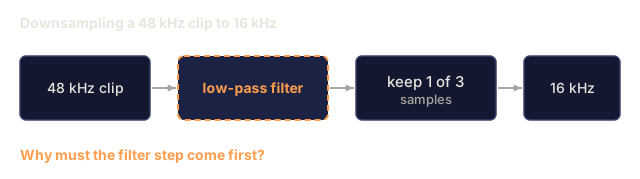
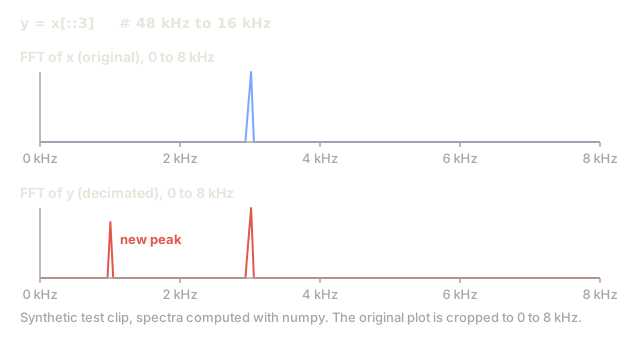
Nyquist-Shannon. A sample rate of sr can unambiguously represent frequencies up to sr/2, a boundary known as the Nyquist frequency. Energy above it gets aliased: folded down into lower frequencies, corrupting the signal. Always low-pass filter before downsampling.

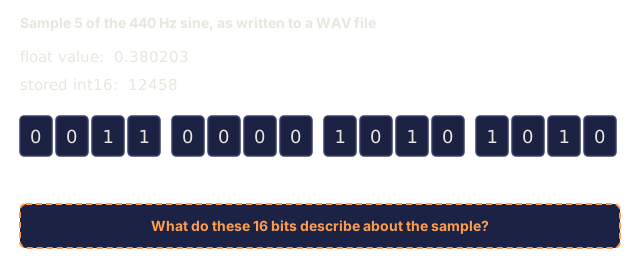
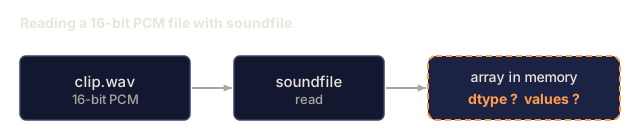
Bit depth. 16-bit PCM (signed int16, range ±32,767) is the universal exchange format. Music runs 24-bit; internal DSP runs 32-bit float. Libraries like soundfile read int16 but expose float32 arrays in [-1, 1].

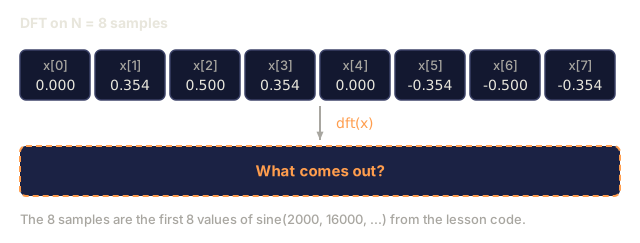
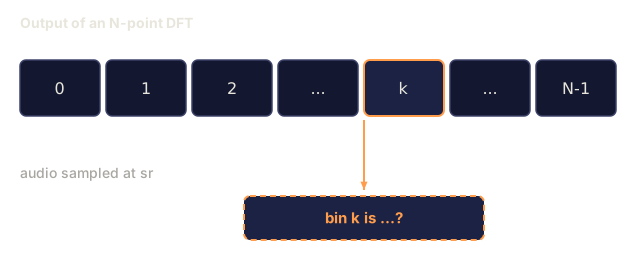
Fourier Transform. Any finite signal is a sum of sinusoids at different frequencies. The Discrete Fourier Transform (DFT) turns N samples into N complex coefficients, one per frequency bin. bin k maps to frequency k · sr / N Hz: magnitude is amplitude at that frequency, angle is phase.

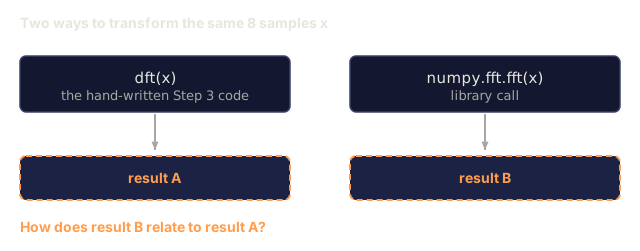
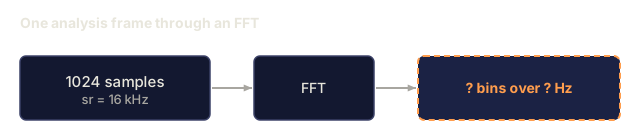
FFT. Fast Fourier Transform: an O(N log N) algorithm for the DFT when N is a power of 2, and the one every audio library actually uses under the hood. A 1024-sample FFT at 16 kHz gives 512 usable frequency bins spanning 0–8 kHz at 15.6 Hz resolution.

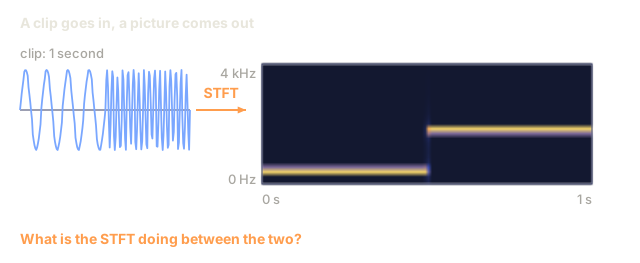
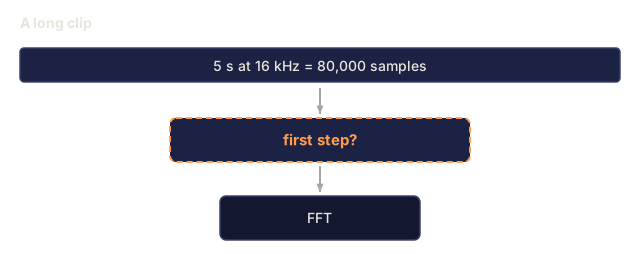
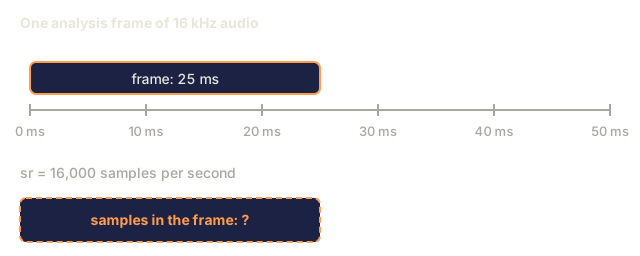
Framing + window. You don’t FFT an entire clip. Instead, chop it into overlapping frames (typically 25 ms with 10 ms hop), multiply each frame by a window function (Hann, Hamming) to kill edge discontinuities, then FFT each frame. This is the Short-Time Fourier Transform (STFT). Lesson 02 picks up from here.
Check: The Concept0/17
1. The lesson defines a waveform as an array of floats in a fixed range, indexed by sample number. What is that range?Define
A sine waveform drawn as a curve with dots for samples against sample index n, with the vertical axis ends marked with question marks.
First 90 samples of a 440 Hz sine at 16 kHz, computed.
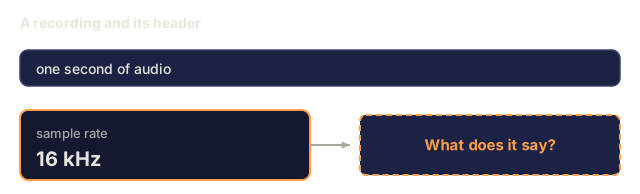
2. What does a sample rate of 16 kHz mean for a recording?Define
A bar labelled one second of audio, a card reading sample rate 16 kHz, and an arrow to a dashed box asking what it says about the recording.
Typed card, not tool output.
3. What is the Nyquist frequency of a signal sampled at rate sr?Define
Flow of three boxes: an analog signal, a sampler running at sr samples per second, and a dashed box asking for the highest frequency the samples can represent.
Schematic.
4. What does bit depth describe?Define
A sample value 0.380203 written as the int16 number 12458 and as sixteen binary digits 0011000010101010, above a dashed box asking what the sixteen bits describe.
Values computed from the lesson's sine and write_wav formula.
5. What does the Discrete Fourier Transform produce from N audio samples?Define
Eight input sample boxes holding the values of a 2 kHz sine, an arrow labelled dft, and a dashed box asking what comes out.
Inputs computed with the lesson's sine function; N=8 for readability.
6. How does the FFT relate to the DFT?Define
Two boxes side by side, the hand-written dft of x and numpy.fft.fft of x, each with an arrow to a dashed result box.
Schematic.
7. In an N-point DFT of audio sampled at sr, what is bin k?Define
A row of DFT output boxes indexed 0, 1, 2, dots, k, dots, N minus 1 with box k highlighted and an arrow to a dashed box asking what bin k is.
Schematic.
8. What is the STFT?Define
A waveform whose second half oscillates faster, an arrow labelled STFT, and a heat map with time on the horizontal axis and frequency from 0 to 4 kHz on the vertical axis.
Left: schematic waveform. Right: computed with numpy from a 440 Hz tone followed by a 1760 Hz tone.
9. What is aliasing?Define
A fast grey 5 kHz sine over one millisecond with seven orange sample dots at 6 kHz spacing.
Computed. The numbers 5 kHz and 6 kHz are chosen for the picture.
10. Why should 8 kHz audio be avoided for ASR?Explain
Three boxes: phone call audio at sr equal to 8 kHz, an ASR model, and a transcript.
Schematic.
11. Why must you low-pass filter before downsampling a 48 kHz clip to 16 kHz?Explain
A flow from a 48 kHz clip through a dashed low-pass filter box and a keep one of three samples box to a 16 kHz clip.
Schematic.
12. Before running an FFT on a long clip, what should you do first?Explain
A bar for a 5 second, 80,000 sample clip, an arrow to a dashed box asking for the first step, then an FFT box.
Schematic.
13. 16-bit PCM is the universal exchange format. What do libraries like soundfile give you after reading it into memory?Explain
A clip.wav box labelled 16-bit PCM, an arrow through a soundfile read box, to a dashed array-in-memory box with dtype and values marked by question marks.
Schematic.
14. A 1024-sample FFT at 16 kHz gives how many usable frequency bins, and over what range?Apply
A 1024-sample frame at 16 kHz going into an FFT, with a dashed output box asking how many bins over what range.
Schematic.
15. How many samples are in one 25 ms analysis frame of 16 kHz audio?Apply
A time axis from 0 to 50 milliseconds with a 25 millisecond frame bracketed on it, a note of 16,000 samples per second, and a dashed box for the sample count.
Schematic.
16. You downsample 48 kHz audio to 16 kHz by keeping every third sample. The FFT shows a strong low-frequency peak that was not in the original recording. What is the most likely cause?Analyze
Two spectra from 0 to 8 kHz: the original shows one peak at 3 kHz, the every-third-sample version shows that peak plus an extra peak near 1 kHz.
Synthetic test clip, computed with numpy.
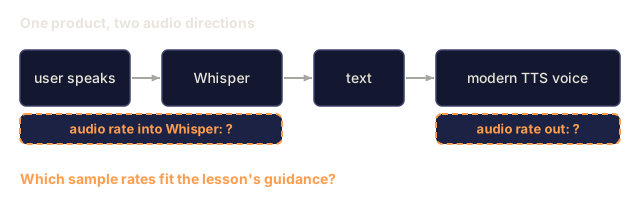
17. A team builds a modern TTS voice and also transcribes user speech with Whisper. Which sample rates fit the lesson's guidance?Design
A flow from user speech through Whisper to text and then a modern TTS voice, with dashed boxes asking the audio rate into Whisper and the rate out of the TTS voice.
Schematic.

Build It

Step 1: read a clip and plot the waveform

code/main.py uses only the stdlib wave module to keep the demo dependency-free. For production you will use soundfile or torchaudio.load (both return (waveform, sr) tuples):

python
import soundfile as sf
waveform, sr = sf.read("clip.wav", dtype="float32")  # shape (T,), sr=int

Step 2: synthesize a sine wave from first principles

python
import math
 
def sine(freq_hz, sr, seconds, amp=0.5):
    n = int(sr * seconds)
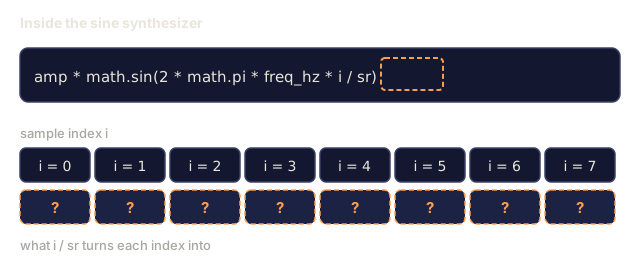
    return [amp * math.sin(2 * math.pi * freq_hz * i / sr) for i in range(n)]

A 440 Hz sine (concert A) at 16 kHz for 1 second is 16,000 floats. Write it out with wave.open(..., "wb") using 16-bit PCM encoding.

Step 3: compute the DFT by hand

python
def dft(x):
    N = len(x)
    out = []
    for k in range(N):
        re = sum(x[n] * math.cos(-2 * math.pi * k * n / N) for n in range(N))
        im = sum(x[n] * math.sin(-2 * math.pi * k * n / N) for n in range(N))
        out.append((re, im))
    return out

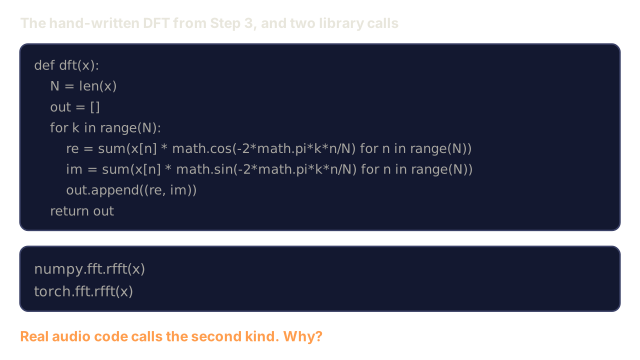
O(N²): fine to confirm correctness at N=256, useless for real audio. Real code calls numpy.fft.rfft or torch.fft.rfft.

Step 4: find the dominant frequency

Magnitude peak index k_star maps to frequency k_star * sr / N. Running this on the 440 Hz sine should return a peak at bin 440 * N / sr.

Step 5: demonstrate aliasing

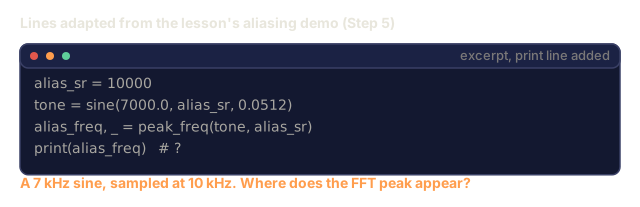
Sample a 7 kHz sine at 10 kHz (Nyquist = 5 kHz). The 7 kHz tone is above Nyquist and folds to 10 − 7 = 3 kHz. The FFT peak appears at 3 kHz. This is the classic aliasing demo, and the reason every DAC/ADC ships with a brick-wall low-pass filter.
Check: Build It0/9
1. The hand-written DFT runs in O(N^2) time. Why should real audio code call numpy.fft.rfft or torch.fft.rfft instead?Explain
The lesson's dft function with a loop over k and an inner sum over n, and below it the two library calls numpy.fft.rfft and torch.fft.rfft.
Code copied from the lesson's Build It step.
2. The sine synthesizer computes each sample as amp * sin(2 * pi * freq_hz * i / sr). What does dividing by sr accomplish?Explain
The lesson's sine expression with the i divided by sr part outlined, above eight index boxes i equals 0 to 7 each with a dashed question mark box beneath.
Code from the lesson's Step 2.
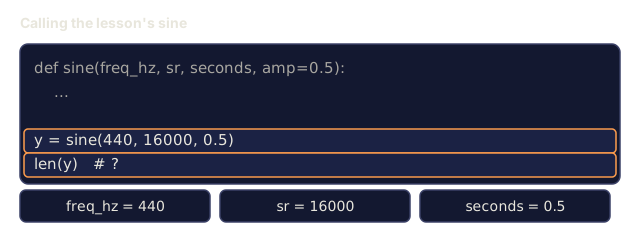
3. The lesson's sine function is called as sine(440, 16000, 0.5). How many samples does it return?Apply
The signature of the sine function, a call sine(440, 16000, 0.5), a len(y) line marked with a question mark, and chips for freq_hz 440, sr 16000 and seconds 0.5.
Signature and call from the stem.
4. In the aliasing demo, a 7 kHz sine is sampled at 10 kHz. Where does the FFT peak appear?Apply
Four lines of the lesson's demo code: a 7000 Hz sine sampled at 10000 Hz, a peak_freq call, and a print marked with a question mark.
Adapted from the lesson's main.py; the print line is added.
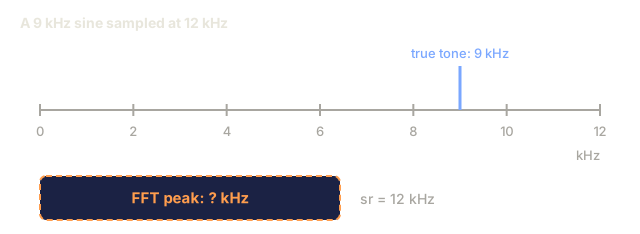
5. A 9 kHz sine is sampled at 12 kHz. Using the same folding rule as the 7 kHz demo, where does the peak land?Apply
A frequency axis from 0 to 12 kHz with a 9 kHz tone marked, sr equal 12 kHz, and a dashed box for the FFT peak frequency.
Schematic.
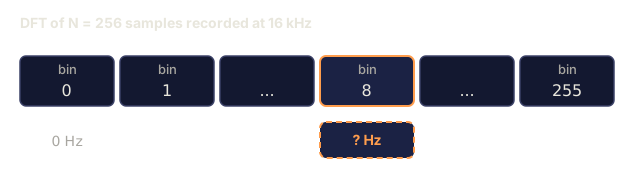
6. The lesson's dft function is run on 256 samples recorded at 16 kHz. Which frequency does bin k = 8 represent?Apply
A row of DFT bins 0, 1, dots, 8, dots, 255 for N equals 256 at 16 kHz, with bin 8 highlighted and a dashed box for its frequency; bin 0 reads 0 Hz.
Schematic.
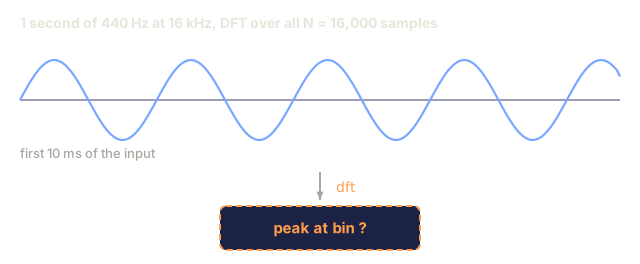
7. A 1-second 440 Hz sine at 16 kHz is run through the DFT using all N = 16,000 samples. At which bin is the magnitude peak?Apply
A 440 Hz sine over its first 10 ms with an arrow labelled dft to a dashed box asking at which bin the peak sits.
Computed waveform.
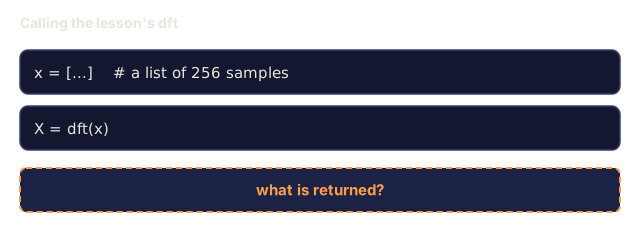
8. The lesson's dft(x) is called with a list of 256 samples. What does it return?Apply
Two code lines, x as a list of 256 samples and X equals dft of x, above a dashed box asking what is returned.
Call from the stem.
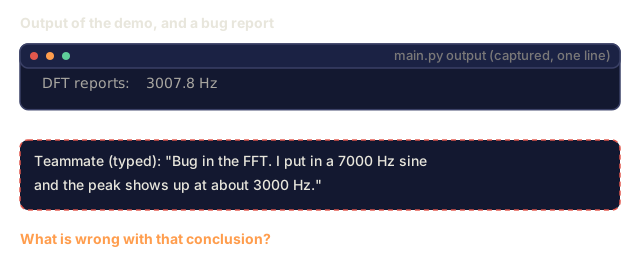
9. A teammate runs the 7 kHz-at-10 kHz demo, sees a peak at 3 kHz, and reports an FFT bug. What is wrong with that conclusion?Analyze
A terminal with the line DFT reports 3007.8 Hz from the lesson's demo, and a typed teammate message saying a 7000 Hz sine shows a peak near 3000 Hz.
Terminal line captured from the lesson's main.py; the teammate message is typed.

Use It

The stack you’ll actually ship in 2026:

TaskLibraryWhy
Read/write WAV/FLAC/OGGsoundfile (libsndfile wrapper)Fastest, stable, returns float32.
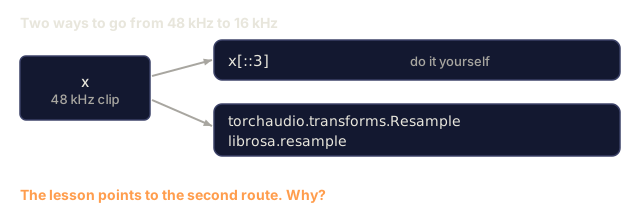
Resampletorchaudio.transforms.Resample or librosa.resampleCorrect anti-aliasing built in.
STFT / Meltorchaudio or librosaGPU-friendly; PyTorch ecosystem.
Real-time streamingsounddevice or pyaudioCross-platform PortAudio bindings.
Inspect a fileffprobe or soxiCLI, fast, reports sr/channels/codec.

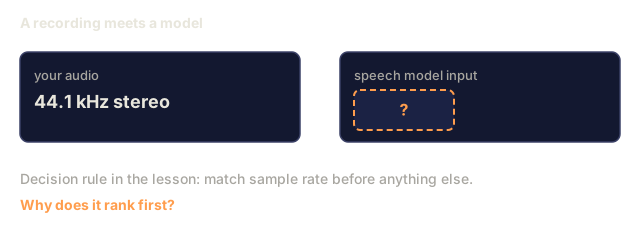
Decision rule: match sample rate before you match anything else. Whisper expects 16 kHz mono float32. Pass it 44.1 kHz stereo and you’ll get garbage that looks like a model bug.

Check: Use It0/5
1. Why does the lesson say to match sample rate before matching anything else?Explain
Two cards: your audio at 44.1 kHz stereo and a speech model input card whose expected format is a dashed question mark.
Schematic.
2. Which library does the lesson recommend for reading and writing WAV/FLAC/OGG, and why?Explain
Three file chips a.wav, b.flac and c.ogg with an arrow to a dashed box asking which library reads them.
Schematic.
3. Why does the lesson point to torchaudio.transforms.Resample or librosa.resample instead of dropping samples yourself?Explain
A 48 kHz clip x splitting into two routes: x with every third sample, and torchaudio Resample or librosa resample.
Schematic.
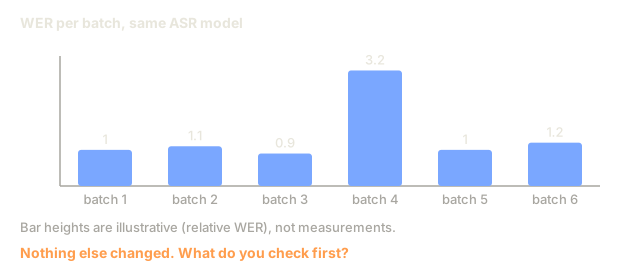
4. Your ASR model's word error rate spikes on one batch of audio, though the model is unchanged and other batches score normally. What should you check first?Analyze
Six bars of word error rate for batches 1 to 6, five of similar height and batch 4 about three times higher.
Illustrative values.
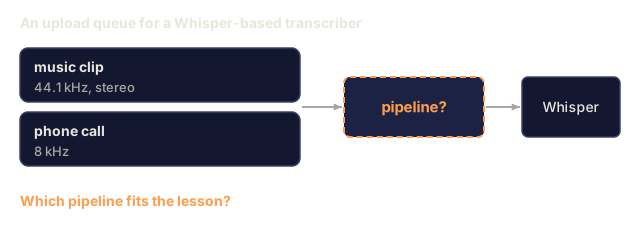
5. You must ingest uploads of mixed origin (44.1 kHz stereo music clips, 8 kHz phone calls) for a Whisper-based transcriber. Which pipeline fits the lesson?Design
Two example uploads, a 44.1 kHz stereo music clip and an 8 kHz phone call, going into a dashed pipeline box before Whisper.
Schematic of the stem's inputs.

Ship It

Save it as outputs/skill-audio-loader.md: a skill that checks whether your audio input matches what the downstream model expects, and resamples it correctly when it doesn’t.

Author's Note

The bug I’ve seen bite the most people isn’t aliasing, it’s the boring one: feeding a model audio at the wrong sample rate. Nobody raises an error for it. A 16 kHz model like Whisper will happily accept a 44.1 kHz array and hand back an answer, just a wrong one, and what comes back looks exactly like a model quality problem: garbled transcripts, a WER spike on some slice of your data, nothing that says "check your sample rate" in plain English. The fix is always the same, and it always takes five minutes once you know to look for it: read the file with soundfile.read or check it with torchaudio.info, and eyeball the sr before you touch the model at all.

Exercises

  1. Easy. Synthesize a 1-second mix of 220 Hz + 440 Hz + 880 Hz at 16 kHz. Run DFT. Confirm three peaks at the expected bins.
  2. Medium. Record a 3-second WAV of your voice at 48 kHz. Downsample to 16 kHz using torchaudio.transforms.Resample (with anti-aliasing), then to 16 kHz using naive decimation (every third sample). FFT both. Where does the aliasing appear?
  3. Hard. Build the STFT from scratch using only math and the DFT from Step 3. Frame size 400, hop 160, Hann window. Plot magnitudes with matplotlib.pyplot.imshow. This is the spectrogram of Lesson 02.

Key Terms

TermWhat people sayWhat it actually means
Sample rateHow many samples per secondFrequency in Hz at which the ADC measures the signal.
NyquistThe max frequency you can representsr/2; energy above it aliases back down.
Bit depthResolution of each sampleint16 = 65,536 levels; float32 = 24-bit precision in [-1, 1].
DFTThe Fourier transform for sequencesN samples → N complex frequency coefficients.
FFTThe fast DFTO(N log N) algorithm requiring N = power of 2.
BinFrequency columnk · sr / N Hz; resolution = sr / N.
STFTSpectrogram under the hoodFramed + windowed FFT over time.
AliasingWeird frequency ghostsEnergy above Nyquist mirroring down to lower bins.

Further Reading

Code

Ships With