TAI BUI
Back to curriculum
BuildPython

Evaluation — FID, CLIP Score, Human Preference

Every generative model leaderboard cites FID, CLIP score, and a win rate from a human-preference arena. Each number has a failure mode a determined researcher can game. If you don't know the failure modes, you can't tell a real improvement from a gaming run.

TIME: ~45 minutesPREREQUISITES: Phase 8 · 01 (Taxonomy), Phase 2 · 04 (Evaluation Metrics)

Learning Objectives

  • Compute FID from Inception-style features and explain why it needs at least 10,000 samples and an ImageNet-like domain
  • Score prompt adherence with CLIP score and name its failure modes: weak composition, short-prompt bias, and prompt gaming
  • Aggregate pairwise human or LLM-judge preferences into Elo and explain why short streams give noisy ratings
  • Assemble a four-pillar production eval report with minimum sample sizes and budget the inference cost of running it

The Problem

A generative model is judged on sample quality and conditioning adherence, and neither has a closed-form measure. Your model renders 10,000 images, something has to assign them numbers, and you have to trust those numbers across model families, resolutions, and architectures. Three metrics survived the 2014-2026 gauntlet:

  • FID (Fréchet Inception Distance). A distance between two distributions, real and generated, in an Inception network's feature space. Lower is better.
  • CLIP score. Cosine similarity between a generated image's CLIP-image embedding and a prompt's CLIP-text embedding. Higher is better. It measures prompt adherence.
  • Human preference. Pit two models head-to-head on the same prompt, have humans (or a GPT-4-class model) pick the better one, and aggregate the picks into an Elo score.

You will also see IS (inception score, largely retired), KID, CMMD, ImageReward, PickScore, HPSv2, and MJHQ-30k. Each one patches a failure of the metric before it.
Warm-up0/3
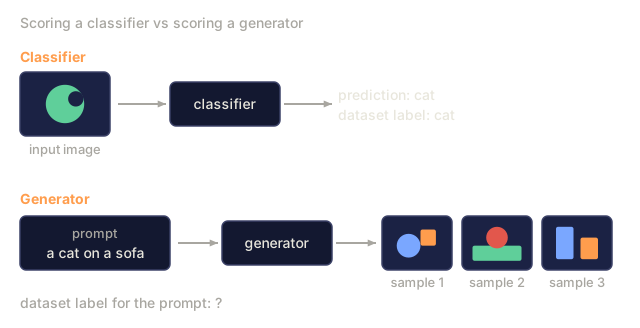
1. Why can't you score a generative model's samples the way you score a classifier, with accuracy against labels?Warm-up
Two rows. A classifier takes an image and outputs a prediction that is compared with a dataset label. A generator takes the prompt 'a cat on a sofa' and produces three different sample tiles, with the dataset label shown as a question mark.
Placeholder tiles and prompt, typed for illustration; no real model was run.
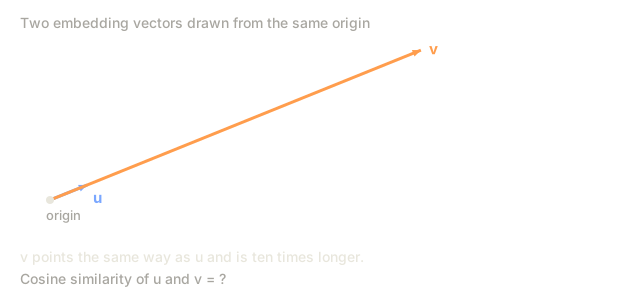
2. Two embedding vectors point in the same direction but one is ten times longer. What is their cosine similarity?Warm-up
Two arrows from one origin pointing in the same direction: a short arrow u and a long arrow v, ten times the length of u.
Arrow lengths drawn to the 1 : 10 ratio in the stem; direction chosen arbitrarily.
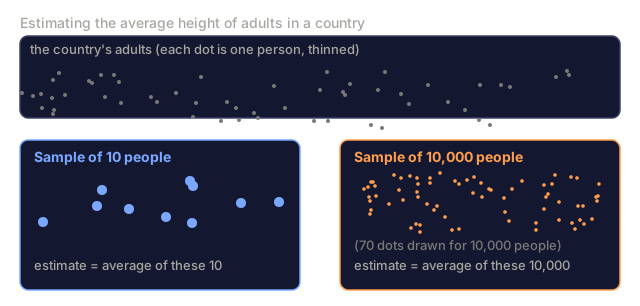
3. You estimate the average height of adults in a country from a random sample. Which estimate do you trust more, and why?Warm-up
The country's adults drawn as a field of dots. Below it, two panels: a sample of 10 people drawn as 10 blue dots, and a sample of 10,000 people drawn as a dense cloud of orange dots, each used to estimate the average height.
Dots are schematic: 70 dots stand in for the 10,000-person sample.
Check: The Problem0/1
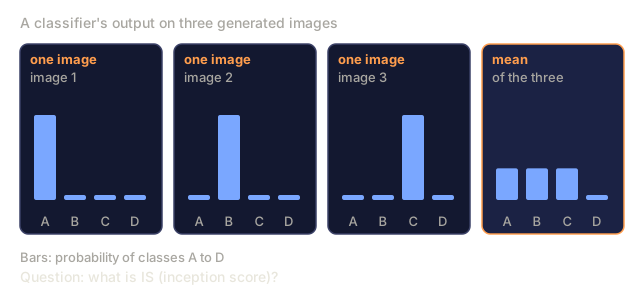
1. What is IS (inception score), and where does it stand today?Define
Four bar panels over classes A to D. Panels for image 1, image 2 and image 3 each show one tall bar of about 0.85 on a different class. The fourth panel, the average of the three, shows three bars of about 0.32 and one of 0.05.
Probabilities are made up for illustration; the average is computed from them.

The Concept

FID, CLIP, and preference: three axes, different failure modes

FID: sample quality

Heusel et al. (2017). The steps:

  1. Extract Inception-v3 features (2048-D) for N real images and N generated.
  2. Fit a Gaussian to each pool: compute mean μ_r, μ_g and covariance Σ_r, Σ_g.
  3. FID = ||μ_r - μ_g||² + Tr(Σ_r + Σ_g - 2 · (Σ_r · Σ_g)^0.5).

Read it as the Fréchet distance between two multivariate Gaussians in feature space. Lower means the distributions are more similar.

Failure modes:

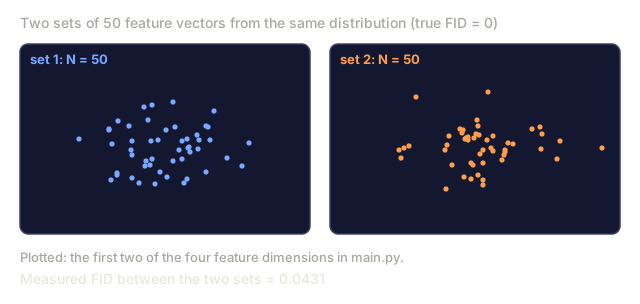
  • Biased on small N. FID is estimated from sample means and covariances, so a small N adds estimation error. Two sets drawn from the same distribution should score 0, and main.py prints a nonzero value that shrinks as N grows. Use at least 10,000 samples.
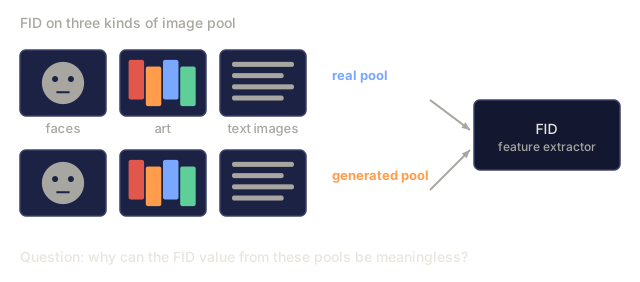
  • Inception-dependent. Inception-v3 was trained on ImageNet, so domains far from ImageNet (faces, art, text images) produce a meaningless FID. Use a domain-specific feature extractor there.
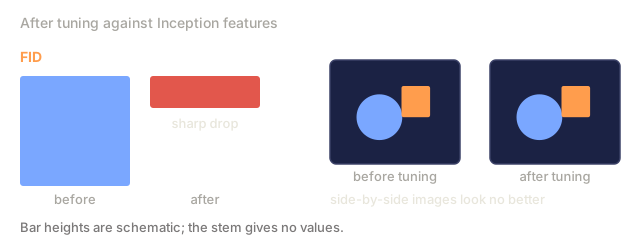
  • Gaming. Overfitting to the Inception prior gives a low FID without any visual quality improvement. CMMD (below) is the counter.

CLIP score: prompt adherence

Radford et al. (2021). For a generated image + prompt:

clip_score = cos_sim( CLIP_image(x_gen), CLIP_text(prompt) )

Average over 30k generated images and you get one scalar you can compare between models.

Failure modes:

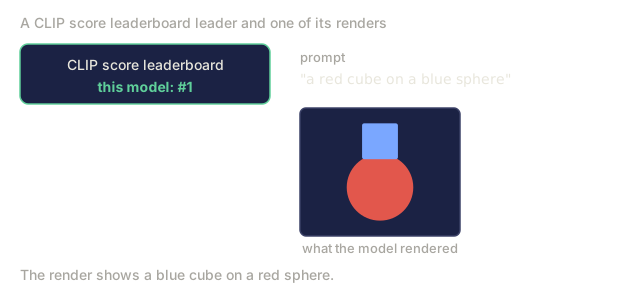
  • CLIP's own blind spots. CLIP has weak compositional reasoning ("a red cube on a blue sphere" often fails). A model can rank well on CLIP score without following complex prompts.
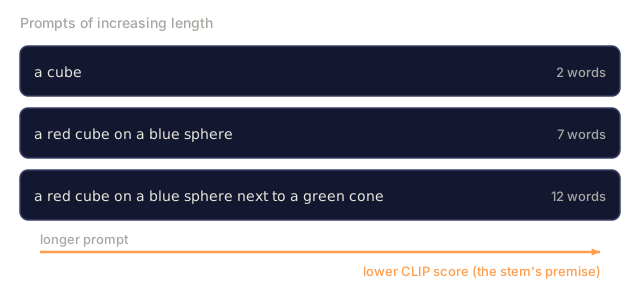
  • Short prompt bias. Short prompts have more CLIP-image matches in the wild. Longer prompts score lower mechanically.
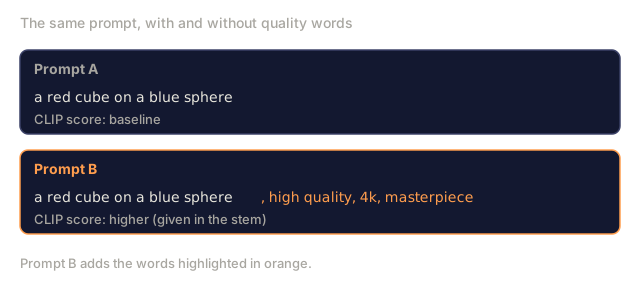
  • Prompt gaming. Including "high quality, 4k, masterpiece" in the prompt inflates CLIP score and does nothing for image-text binding.

CMMD (Jayasumana et al., 2024) fixes some of these. It uses CLIP features instead of Inception and maximum-mean discrepancy instead of a Fréchet distance, and it detects subtle quality differences better.

Human preference: the ground truth

Pick a pool of prompts. Generate with model A and model B. Show pairs to humans (or a strong LLM judge) and aggregate the wins into an Elo or Bradley-Terry score. The benchmarks:

  • PartiPrompts (Google): 1,600 diverse prompts, 12 categories.
  • HPSv2: 107k human annotations, widely used as automated proxy.
  • ImageReward: 137k prompt-image preference pairs, MIT-licensed.
  • PickScore: trained on Pick-a-Pic 2.6M preferences.
  • Chatbot-Arena-style image arenas: https://imagearena.ai/ and others.

Failure modes:

  • Judge variance. Non-experts prefer different images than experts do. Use both.
  • Prompt distribution. Cherry-picked prompts favor one model family. Document the prompt set.
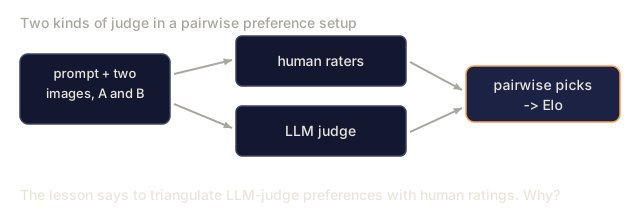
  • LLM-judge reward hacking. A GPT-4 judge gets fooled by pretty-but-wrong outputs. Triangulate with human ratings.
Check: The Concept0/15
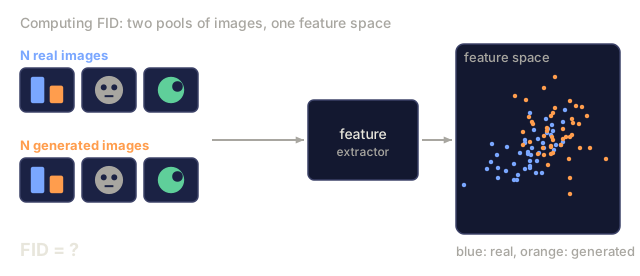
1. What does FID compute?Define
Left: a row of N real image tiles and a row of N generated image tiles. Both feed a box labelled feature extractor. Right: a feature-space panel with a blue cloud of real points and an orange cloud of generated points. Below, 'FID = ?'.
Image tiles are placeholders. The clouds are random 2-D points standing in for 2048-D features.
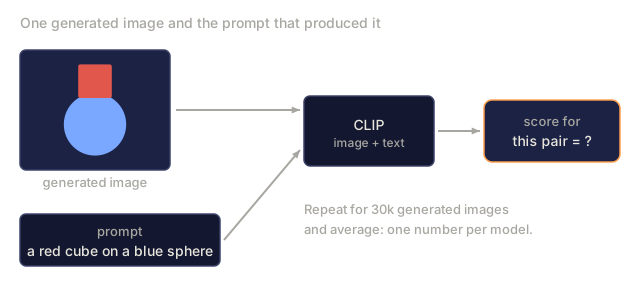
2. What is CLIP score?Define
A generated image of a red cube on a blue sphere and its prompt both feed into a box labelled CLIP, which outputs a score for the pair shown as a question mark. A note says the pair score is repeated over 30k generated images and averaged to one number per model.
Image is a placeholder drawing; the prompt is the lesson's own example.
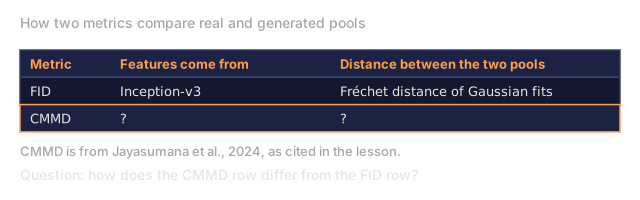
3. What is CMMD, and how does it differ from FID?Define
A two-row table of metrics. The FID row says features come from Inception-v3 and the distance is a Fréchet distance of Gaussian fits. The CMMD row has question marks in both columns.
FID row as described in the lesson.
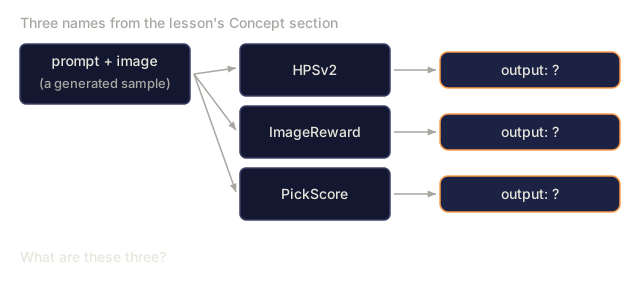
4. What are HPSv2, ImageReward and PickScore?Define
A prompt and image sample on the left with arrows to three boxes named HPSv2, ImageReward and PickScore. Each box leads to a card reading 'output: ?'.
Names as listed in the lesson's Concept section.
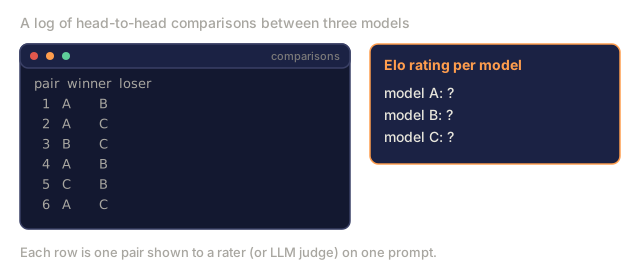
5. What is Elo in this lesson's evaluation setting?Define
A terminal-style log of six head-to-head comparisons between models A, B and C with a winner and loser each. Next to it, a card asking for an Elo rating per model with question marks.
The comparison log is typed for illustration, not real data.
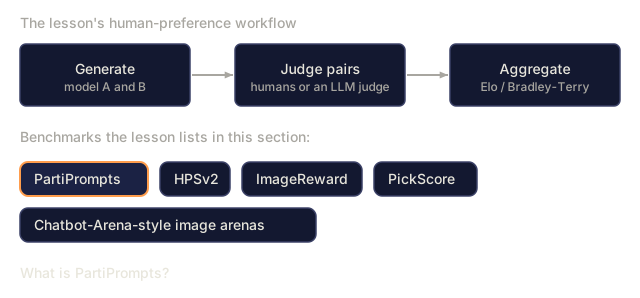
6. What is PartiPrompts?Define
A three-box flow: generate with model A and B, judge pairs by humans or an LLM, aggregate into Elo or Bradley-Terry. Below it, five chips naming the benchmarks the lesson lists: PartiPrompts highlighted, HPSv2, ImageReward, PickScore and Chatbot-Arena-style image arenas.
Workflow and benchmark names as listed in the lesson; descriptions left out.
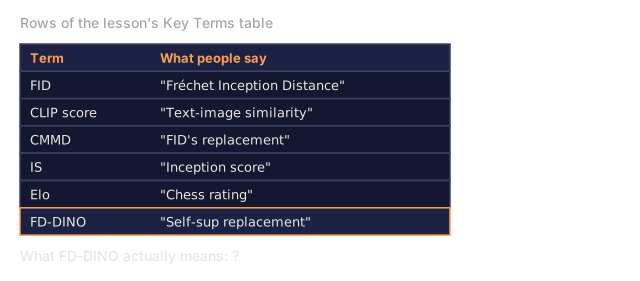
7. What is FD-DINO?Define
Six rows of the lesson's Key Terms table showing only the 'What people say' column: FID, CLIP score, CMMD, IS, Elo, and FD-DINO highlighted with the phrase 'Self-sup replacement'. A line below asks what FD-DINO actually means.
Selected rows quoted from the lesson's Key Terms table; the meaning column is left out.
8. Adding 'high quality, 4k, masterpiece' to a prompt raises CLIP score. Why does that not show the model follows the prompt better?Explain
Two prompt cards. Prompt A is 'a red cube on a blue sphere' with baseline CLIP score. Prompt B is the same text plus ', high quality, 4k, masterpiece' highlighted in orange, with a higher CLIP score as the stem states.
Prompt text from the lesson and the stem; no scores were computed.
9. Why can FID be meaningless on faces, art, or text images?Explain
Three columns of placeholder tiles labelled faces, art and text images, each with a real-pool tile on top and a generated-pool tile below. Arrows from the real and generated pools lead into a box labelled FID, feature extractor.
Tiles are placeholders, not real images.
10. Two sets drawn from the same distribution have a true FID of 0. Why does the measured FID come out above 0 at small N?Explain
Two scatter panels of 50 points each, blue for set 1 and orange for set 2, drawn from the same distribution, showing the first two of four feature dimensions. A line gives the measured FID between them as 0.0431.
Points are the lesson's main.py N=50 draw (seed 29), re-run here.
11. Why do longer prompts score lower on CLIP score mechanically?Explain
Three prompt rows of increasing length: 'a cube' (2 words), 'a red cube on a blue sphere' (7 words), and 'a red cube on a blue sphere next to a green cone' (12 words). An arrow points toward longer prompts and the label says lower CLIP score.
Prompts typed for illustration; no scores were computed. Lower score for longer prompts is the stem's premise.
12. Why does the lesson say to triangulate LLM-judge preferences with human ratings?Explain
A prompt and two images A and B feed two judges, human raters and an LLM judge, whose picks both go into pairwise picks and then Elo. A line asks why the lesson says to triangulate LLM-judge preferences with human ratings.
Workflow as described in the lesson.
13. A model tops the CLIP score leaderboard, yet it renders 'a red cube on a blue sphere' with the colors swapped. Which limitation explains the mismatch?Analyze
A card saying the model is number one on the CLIP score leaderboard, the prompt 'a red cube on a blue sphere', and a drawn render of a blue cube on a red sphere.
Placeholder drawing of the stem's swapped-colors render.
14. After tuning against Inception features, a team's FID drops sharply, but side-by-side images look no better. What is the likely cause and a sensible cross-check?Analyze
Left: a tall FID bar before tuning and a much shorter FID bar after tuning, labelled sharp drop. Right: two identical placeholder image tiles for before and after tuning with the note that they look no better.
Schematic: bar heights and tiles are illustrative; the stem gives no values.
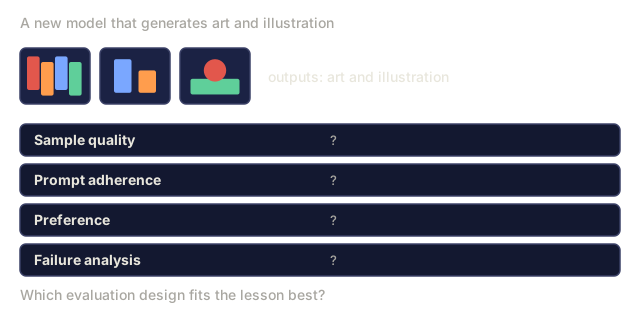
15. You are evaluating a new model that generates art and illustration. Which evaluation design fits the lesson best?Design
Placeholder art tiles labelled outputs: art and illustration, above four pillar rows to design: sample quality, prompt adherence, preference and failure analysis, each with a question mark.
Tiles are placeholders; pillar names from the lesson.

Use together

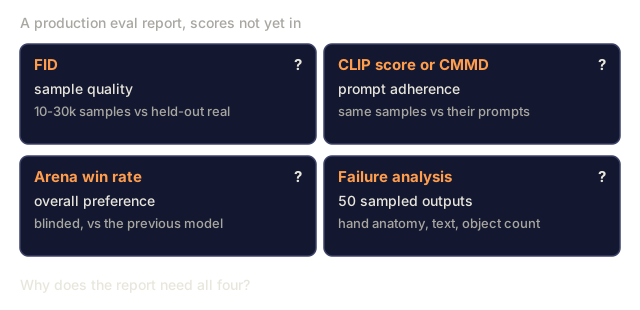
A production eval report should include:

  1. FID on 10-30k samples against a held-out real distribution (sample quality).
  2. CLIP score or CMMD on the same samples against their prompts (adherence).
  3. Win rate in a blinded arena against the previous model (overall preference).
  4. Failure mode analysis: 50 randomly sampled outputs, flagged for known issues (hand anatomy, text rendering, consistent object count).

Any single metric is a lie. Three corroborating metrics plus a qualitative review are a claim.
Check: Use together0/1
1. Why does a production eval report combine FID, CLIP score or CMMD, arena win rate and failure analysis?Explain
Four cards in a grid for a production eval report: FID for sample quality, CLIP score or CMMD for prompt adherence, arena win rate for overall preference, and failure analysis of 50 sampled outputs. Each card has a question mark where its result would go.
Card contents condensed from the lesson's production report list.

Build It

main.py implements FID, a CLIP-style score, and Elo aggregation on synthetic "feature vectors" (4-D vectors stand in for Inception features). It shows three things:

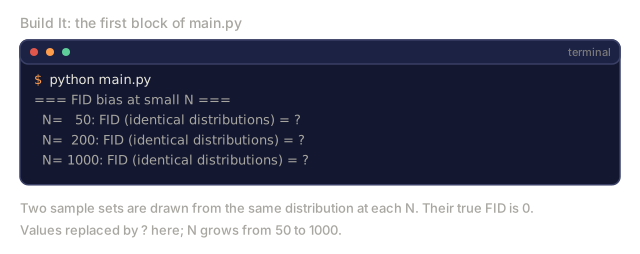
  • FID on identical distributions at N=50, 200, and 1000, so you can see the small-N estimation error. A second block shifts the generated mean to show FID rising with the gap.
  • A "CLIP score" as cosine similarity between feature vectors, scored against image vectors centered at +1.0, +0.5, 0.0, and -0.5.
  • The Elo update rule applied to a synthetic preference stream.

The snippets below are condensed from main.py (which also builds the covariance and a Jacobi matrix square root by hand).

Step 1: FID in a few lines

python
def fid(real_features, gen_features):
    mu_r, cov_r = mean_and_cov(real_features)
    mu_g, cov_g = mean_and_cov(gen_features)
    mean_diff = sum((a - b) ** 2 for a, b in zip(mu_r, mu_g))
    trace_term = trace(cov_r) + trace(cov_g) - 2 * sqrt_cov_product(cov_r, cov_g)
    return mean_diff + trace_term

Step 2: CLIP-style cosine-similarity

python
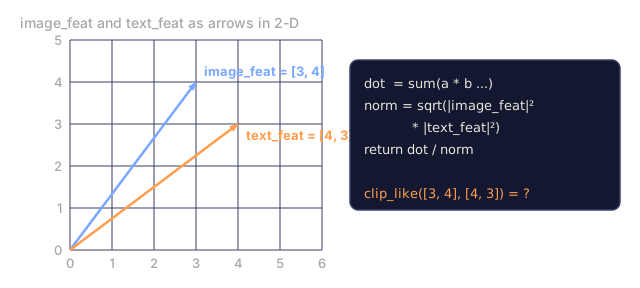
def clip_like(image_feat, text_feat):
    dot = sum(a * b for a, b in zip(image_feat, text_feat))
    norm = math.sqrt(dot_self(image_feat) * dot_self(text_feat))
    return dot / max(norm, 1e-8)

Step 3: Elo aggregation

python
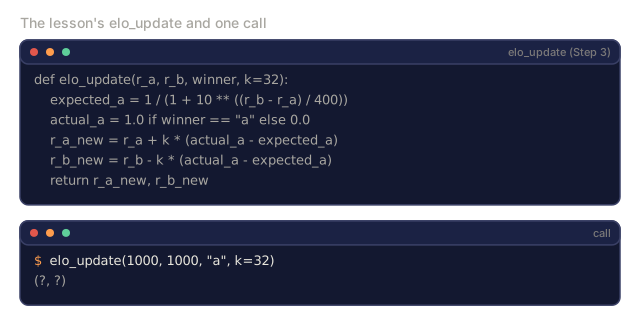
def elo_update(r_a, r_b, winner, k=32):
    expected_a = 1 / (1 + 10 ** ((r_b - r_a) / 400))
    actual_a = 1.0 if winner == "a" else 0.0
    r_a_new = r_a + k * (actual_a - expected_a)
    r_b_new = r_b - k * (actual_a - expected_a)
    return r_a_new, r_b_new
Check: Build It0/6
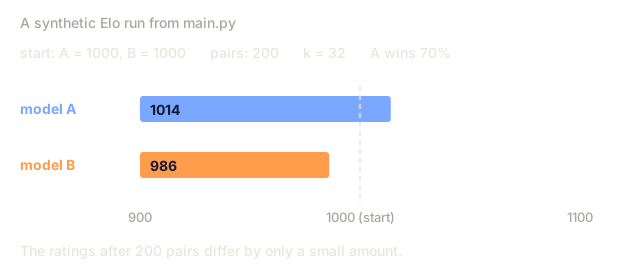
1. A synthetic Elo run ends with a small rating gap after 200 pairs even though A wins 70% of them. What explains it?Explain
Header: both models start at 1000, 200 pairs, k = 32, A wins 70 percent. Two bars on a 900 to 1100 scale show model A at 1014 and model B at 986, with a dashed line at the 1000 start.
Final ratings are from re-running the lesson's main.py (seed 29).
2. In Build It, `main.py` scores two sample sets drawn from the same distribution. What does the first block print as N grows from 50 to 1000?Apply
A terminal showing the command python main.py and the first output block 'FID bias at small N' with three lines for N = 50, 200 and 1000 whose values are replaced by question marks.
Layout copied from the real main.py output; the values are hidden.
3. Using `elo_update` with k=32, A and B both start at 1000 and A wins. What are the new ratings?Apply
The lesson's elo_update function in a code box, and below it the call elo_update(1000, 1000, 'a', k=32) with the result shown as (?, ?).
Code as in the lesson's Step 3.
4. Using `clip_like`, what is the score for image_feat = [3, 4] and text_feat = [4, 3]?Apply
A 2-D grid with two arrows from the origin: image_feat = [3, 4] in blue and text_feat = [4, 3] in orange. A code card summarises clip_like (dot product divided by the product of norms) and asks for clip_like([3, 4], [4, 3]).
Code summarised from the lesson's clip_like.
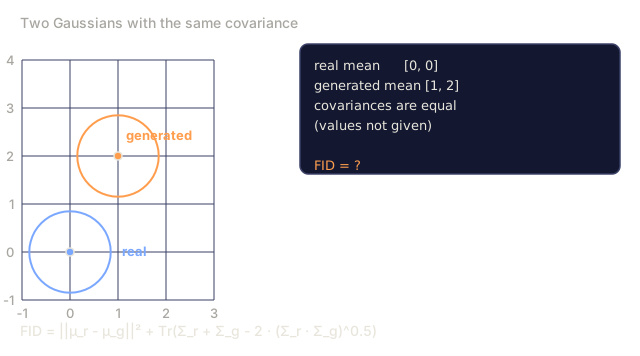
5. Using the `fid` formula, real features have mean [0, 0] and generated features have mean [1, 2], and both have the same covariance. What is the FID?Apply
A grid from -1 to 3 on x and -1 to 4 on y. A blue Gaussian ellipse is centred at [0, 0] and an orange one of the same shape at [1, 2]. A card lists the means, equal covariances and FID = ?, with the lesson's FID formula below.
Ellipse size is arbitrary: the stem gives no covariance values.
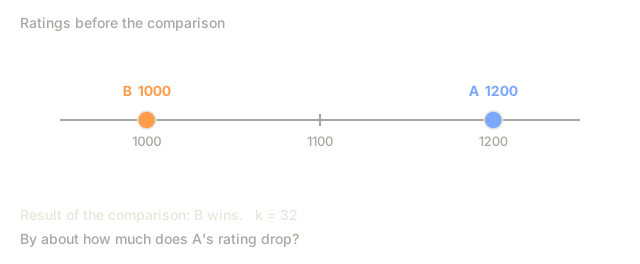
6. Using `elo_update` with k=32, A is rated 1200 and B is rated 1000, and B wins. By about how much does A's rating drop?Apply
A rating scale from about 950 to 1250 with model A marked at 1200 and model B at 1000, and the note that B wins with k = 32.
Scale drawn from the stem's numbers.

Pitfalls

  • FID at N=1000. The estimate is unreliable under N=10k. Papers that report low-N FID are gaming.
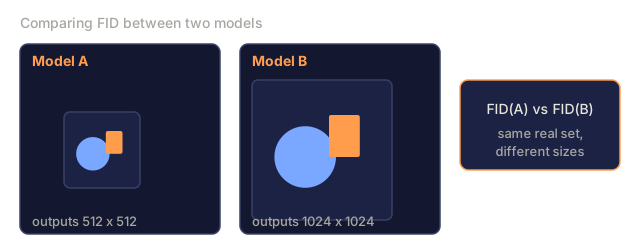
  • Comparing FID across resolutions. Inception's 299×299 resize changes the feature distribution, so compare at matched resolution only.
  • Reporting one seed. Run 3 seeds at minimum and report the std.
  • CLIP score inflation via negative prompts. Some pipelines boost CLIP by over-fitting the prompt. Check the outputs for visual saturation.
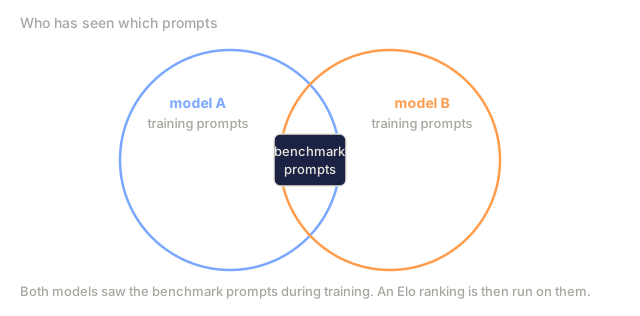
  • Elo bias from prompt overlap. If both models saw a benchmark prompt during training, the Elo means nothing. Use held-out prompt sets.
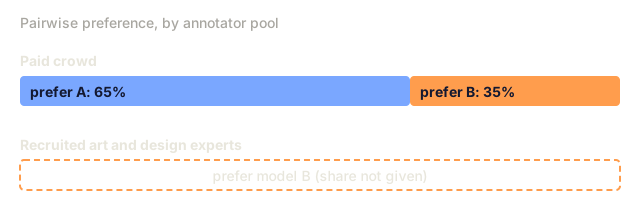
  • Human eval paid-crowd skew. Prolific and MTurk annotators skew younger and tech-friendly. Mix in recruited art and design experts.
Check: Pitfalls0/4
1. Why must FID only be compared at matched resolution?Explain
Two model cards: Model A outputs 512 x 512 images drawn as a smaller tile, Model B outputs 1024 x 1024 images drawn as a larger tile. A card on the right says their FID values are being compared.
Resolutions are illustrative; the stem names no sizes. Tiles are placeholders.
2. Why does the lesson say an Elo ranking means nothing if both models saw the benchmark prompts during training?Explain
Two overlapping circles, model A training prompts in blue and model B training prompts in orange. A small box labelled benchmark prompts sits inside the overlap. A line says both models saw the benchmark prompts in training and an Elo ranking is run on them.
Schematic; no counts are implied.
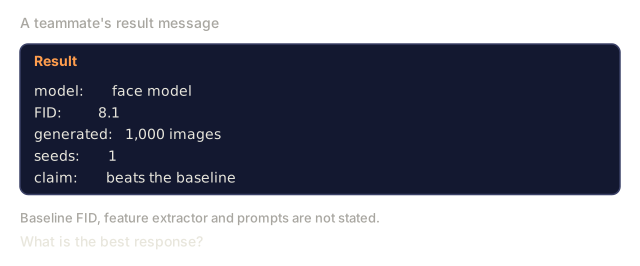
3. A teammate reports FID 8.1 on a face model from 1,000 generated images and one seed, and wants to claim it beats the baseline. What is the best response?Analyze
A result card from a teammate: face model, FID 8.1, 1,000 generated images, 1 seed, and the claim that it beats the baseline. A note says the baseline FID and feature extractor are not stated.
Typed from the stem.
4. Paid-crowd annotators prefer model A in 65% of pairs, but recruited art and design experts prefer model B. What is the best reading and next step?Analyze
Two bars. Paid crowd: 65 percent prefer model A (blue) and 35 percent prefer model B (orange). Recruited art and design experts: a dashed bar saying they prefer model B, with the share not given.
The 65% is from the stem; the 35% is its complement; the experts' share is not given.

Use It

The production eval protocol in 2026:

PillarMinimumRecommended
Sample qualityFID on 10k vs held-out real+ CMMD on 5k + FID on subset per category
Prompt adherenceCLIP score on 30k+ HPSv2 + ImageReward + VQA-style question answering
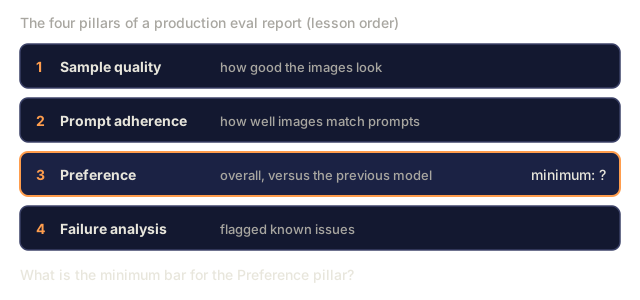
Preference200 blinded pairs vs baseline+ 2000 paired human + LLM-judge + Chatbot Arena
Failure analysis50 hand-flagged500 hand-flagged + automated safety classifier

All four pillars in one report make a claim. Any one alone is marketing.
Check: Use It0/2
1. In the production eval table, what is the minimum bar for the Preference pillar?Explain
Four numbered rows for the pillars sample quality, prompt adherence, preference and failure analysis, each with a short description. The Preference row is highlighted with 'minimum: ?'.
Pillar names and descriptions condensed from the lesson's production report list.
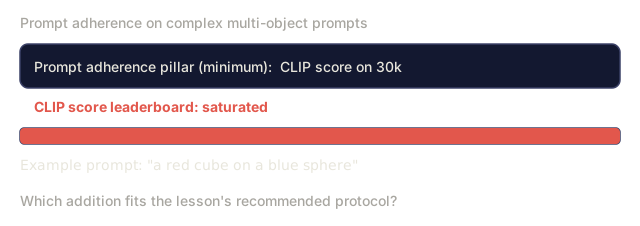
2. Your model must follow complex multi-object prompts, and CLIP score alone is saturated. Which addition fits the lesson's recommended protocol?Design
A card for the prompt adherence pillar, CLIP score on 30k, above a full-width bar labelled CLIP score leaderboard saturated, and the example prompt 'a red cube on a blue sphere'.
Schematic: the bar means 'saturated' as the stem says; there is no scale.

Ship It

Save outputs/skill-eval-report.md. The skill takes a new model checkpoint plus a baseline and outputs a full eval plan: sample sizes, metrics, failure-mode probes, and sign-off criteria.

Author's Note

I'd run main.py and read the first block before anything else. It scores two sets of 4-D vectors drawn from the same distribution at N=50, 200, and 1000. The true FID there is zero, so whatever prints is estimation error, and in my run it shrinks as N grows. That is the cheapest way I know to see why the Pitfalls list says to distrust low-N numbers.

The second block is where I'd slow down. FID rises with the shift between the real and generated means, which is what you want from a distance. The CLIP-like block is less flattering: it is plain cosine similarity, and the image vectors are a constant plus noise, so the +1.0 and +0.5 centers land close together. A score that only sees direction can hide a gap that you would care about.

The Elo block ends with a small rating gap after 200 pairs even though A wins 70% of them. I'd read that as a reminder that the update uses k=32 and moves on every single pair, so a short stream gives a noisy rating. All of it runs on synthetic features, so none of the numbers say anything about a real Inception or CLIP model. The code makes the formulas concrete, and the failure modes in the body are where the real judgment goes.

Exercises

  1. Easy. Run main.py. Compare FID at N=50 vs N=1000 on the same synthetic distributions. Report the bias magnitude.
  2. Medium. Implement CMMD from synthetic CLIP-style features (see Jayasumana et al., 2024 for the formula). Compare sensitivity to quality differences vs FID.
  3. Hard. Replicate the HPSv2 setup: take 1000 image-prompt pairs from a subset of Pick-a-Pic, fine-tune a small CLIP-based scorer on the preferences, and measure its agreement with a held-out set.

Key Terms

TermWhat people sayWhat it actually means
FID"Fréchet Inception Distance"Fréchet distance of Gaussian fits to real vs gen Inception features.
CLIP score"Text-image similarity"Cosine similarity between CLIP image and text embeddings.
CMMD"FID's replacement"CLIP-feature MMD; less biased, no Gaussian assumption.
IS"Inception score"Exp KL(p(y
HPSv2 / ImageReward / PickScore"Learned preference proxies"Small models trained on human preferences; used as automatic judges.
Elo"Chess rating"Bradley-Terry aggregation of pairwise wins.
PartiPrompts"The benchmark prompt set"1,600 Google-curated prompts across 12 categories.
FD-DINO"Self-sup replacement"FD using DINOv2 features; better for out-of-ImageNet domains.

Production note: evaluation is an inference workload too

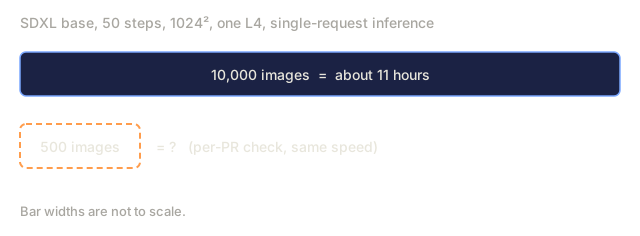
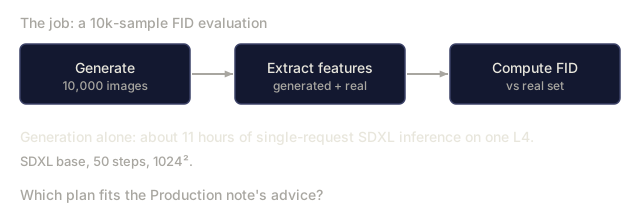
Running FID on 10k samples means generating 10k images. For a 50-step SDXL base at 1024² on a single L4, that is ~11 hours of single-request inference. Evaluation budgets are real, and the framing is the offline-inference scenario: maximize throughput and ignore TTFT.

  • Batch hard, forget latency. Offline eval is static batching at the largest size that fits in memory. pipe(...).images with num_images_per_prompt=8 on an 80GB H100 runs 4-6× faster in wall-clock than single-request.
  • Cache the real features. Extract the Inception (FID) or CLIP (CLIP score, CMMD) features for the real reference set once and store them as a .npz. Don't recompute them per eval.

For CI and regression gates, run FID + CLIP score on a 500-sample subset per PR (~30 min), and run the full 10k FID + HPSv2 + Elo nightly.
Check: Production note: evaluation is an inference workload too0/2
1. The Production note says 10k SDXL samples take about 11 hours of single-request inference on an L4. About how long do the 500-sample per-PR checks take at the same speed?Apply
A solid bar labelled 10,000 images, about 11 hours, and a dashed box labelled 500 images with a question mark for its time on the same speed. A note says bar widths are not to scale.
Figures from the lesson's Production note.
2. You must run a 10k-sample FID evaluation, which the Production note estimates at about 11 hours of single-request SDXL inference on one L4. Which plan fits its advice?Design
A three-box flow: generate 10,000 images, extract features from generated and real images, compute FID against the real set. A line states generation alone takes about 11 hours of single-request SDXL inference on one L4.
Figures from the stem and the lesson's Production note.

Further Reading

Code

Ships With